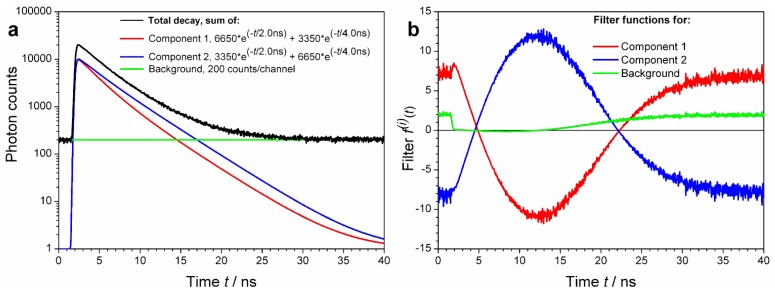
Figure 3.
Simulated, realistic decay curve, its components and their calculated FLCS filter functions. (a) Two bi-exponential decay functions with the indicated amplitudes and lifetimes were convoluted with a real instrument response function (IRF not shown) resulting in Components 1 and 2, respectively. They have different average lifetimes, 3.00 ns and 3.60 ns, respectively, in spite of the same lifetime constituents. Uniform background (200 counts in each TCSPC channel) is added. The total decay curve is an arithmetic sum of these three components, plus the Poisson noise. (b) Calculated filter functions for decay components of the Total decay curve. Although the goal is to resolve Component 1 from Component 2, finding and subtracting the decay background (the third “decay” pattern) is so trivial that it always should be included in the filter calculation. The advantage is that the resulting autocorrelation functions (ACFs) for Components 1 and 2 will be purged of detector after pulsing and uncorrelated background contributions.

