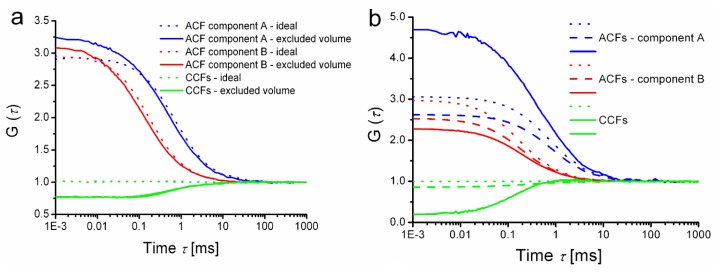
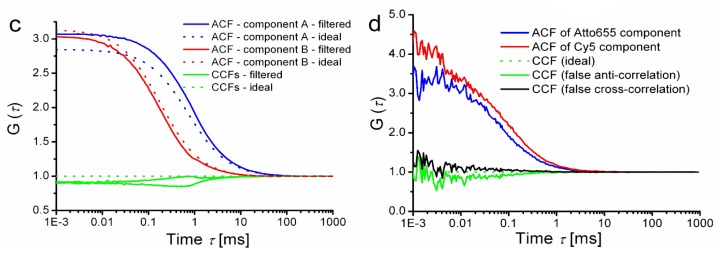
Figure 4.
Illustration of possible sources of anticorrelation in FLCS. (a) to (c): Two-dimensional diffusion was simulated in a 6 μm × 6 μm square simulation box with periodic boundaries with 1 μs step; the Gaussian detection area had a radius of 240 nm; the simulated sample contains a mixture of two components A and B characterized by diffusion coefficients 20 μm2s−1 and 80 μm2s−1 and fluorescence lifetimes 4 ns and 2 ns, respectively. (a) Influence of the excluded volume; the ideal situation with point-like particles (dotted lines) is compared with the situation in which each particle occupies 4.4% of the detection area (solid lines). (b) Influence of electronic dead-time; brightness was 400 kHz per particle, average count rate 394 kHz and electronic dead-time 1 μs. Three cases are compared: correlation functions calculated using all photons (dead-time free, ideal situation, dotted lines), calculated considering the dead-time and using the knowledge which of the simulated molecules emitted each photon (dashed lines) and finally considering dead-time and using FLCS filtering to separate the components (solid lines) (c) Influence of detector timing jitter due to intensity-dependent IRF shift on ACFs and CCFs (solid lines). The signal rate dependent jitter was simulated as follows: IRF shift in ps units was 2.4 times the number of photons counts in the last 1 ms. With 41.284 kHz average count rate it means approximately 100 ps average (but fluctuating) shift. Ideal correlation functions calculated using the knowledge which of the simulated molecules emitted each photon instead of FLCS filtering is shown for comparison (dotted lines). Note that the parameters of the shift were chosen arbitrarily and do not simulate any particular type of single photon avalanche diode (SPAD). (d) Real experimental data, examples of FLCS CCFs obtained from a mixture of Cy5 and Atto655 [39]; negative CCF amplitude appears even with well matched TCSPC patterns (green solid line) while a deliberate shift of one of the patterns by 60 ps gives rise to a positive cross-correlation (black solid line). FLCS filtered, separated component ACFs of the two compounds are plotted for comparison, in order to demonstrate the relative amplitude of the effects (blue and red lines).The input data were taken from a sample workspace of a commercial software (SymPhoTime, version 5.3.2, PicoQuant, Berlin, Germany, 2010).


