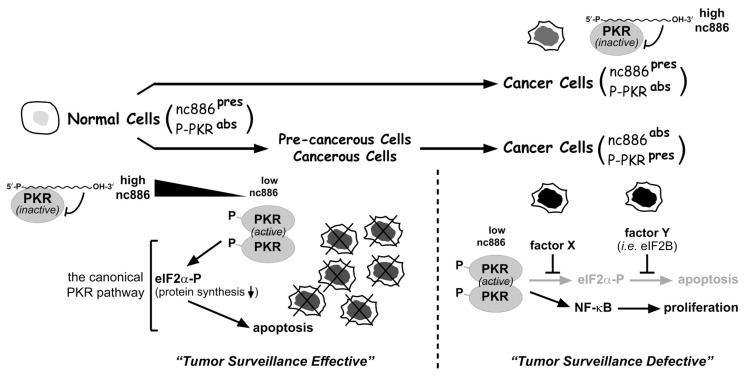
Figure 1.
Illustration of the nc886-PKR tumor surveillance model. This cartoon has been modified from [12]. Active pathways are in black arrows; inactivated pathways are in grey arrows. Superscripted “pres” and “abs” indicate “present” and “absent”, respectively. See also the main text for the description of this illustration.

