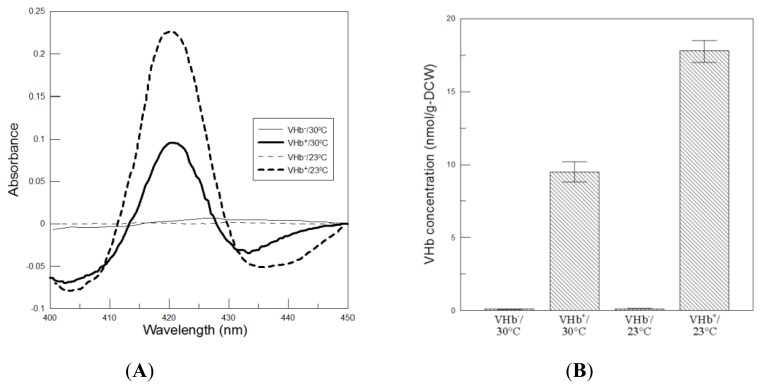
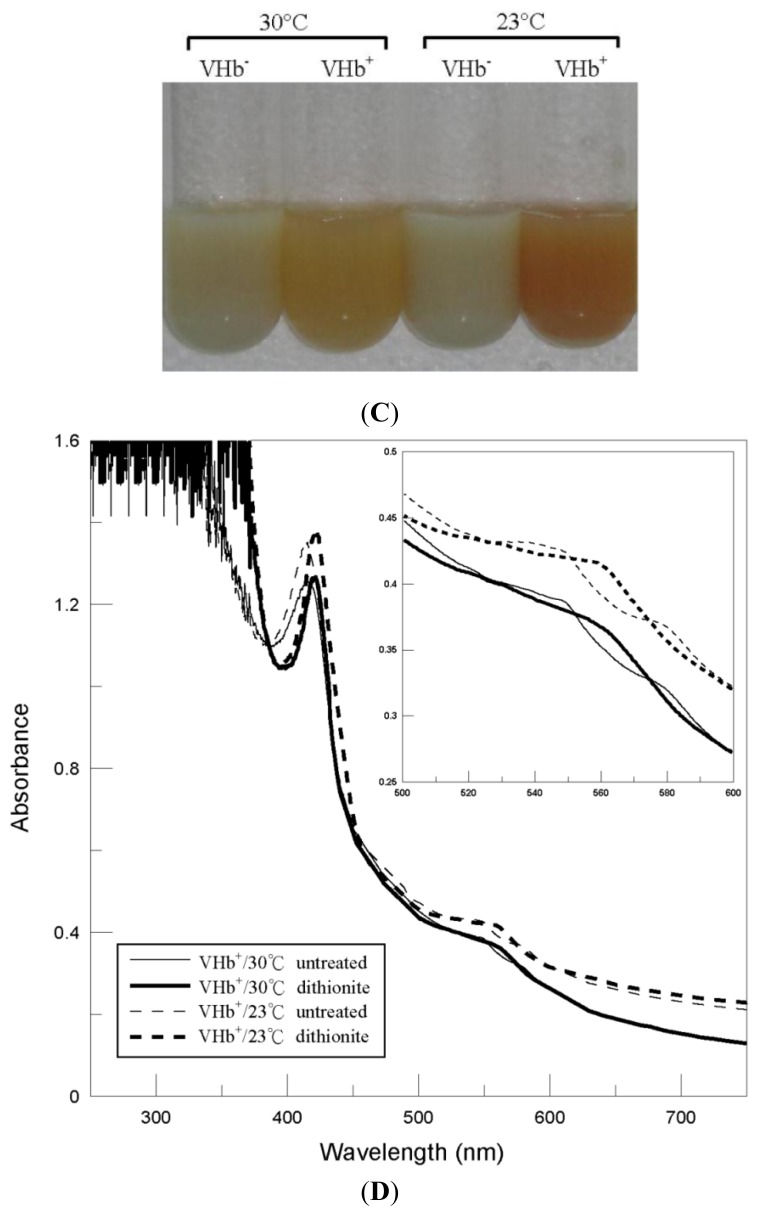
Figure 3.
Analysis of VHb expression at the end of 216 h of culture at two temperatures. (A) CO-difference spectra of crude protein extracts. The difference in absorbance between CO-dithionite-reduced and dithionite-reduced samples is plotted; (B) Bar chart of VHb activity. Data are the means of three independent replicates. Error bars indicate standard deviations; (C) Total cell lysates after ultrasonicated treatment. The detailed procedure is described in Section 3.4; (D) Visible absorption spectra of crude VHb extracts in the oxygenated (untreated samples) and deoxygenated (dithionite reduced samples) forms.


