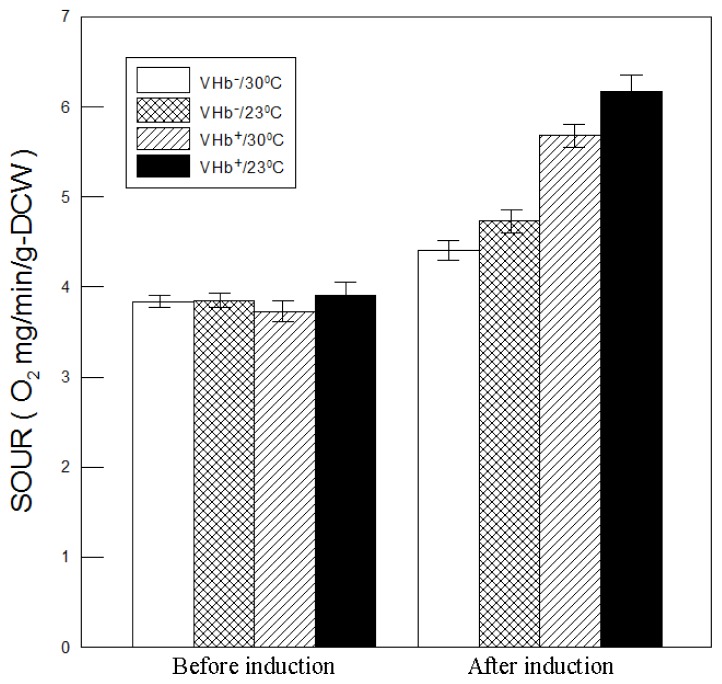
Figure 7.
Comparison of specific oxygen uptake rates (SOURs) of VHb+ and VHb− strains cultured at two temperatures. The values for before induction were measured after 24 h of culture, and the values for after induction were the maximal values measured after induction. Data are the means of three independent replicates. Error bars indicate standard deviations.

