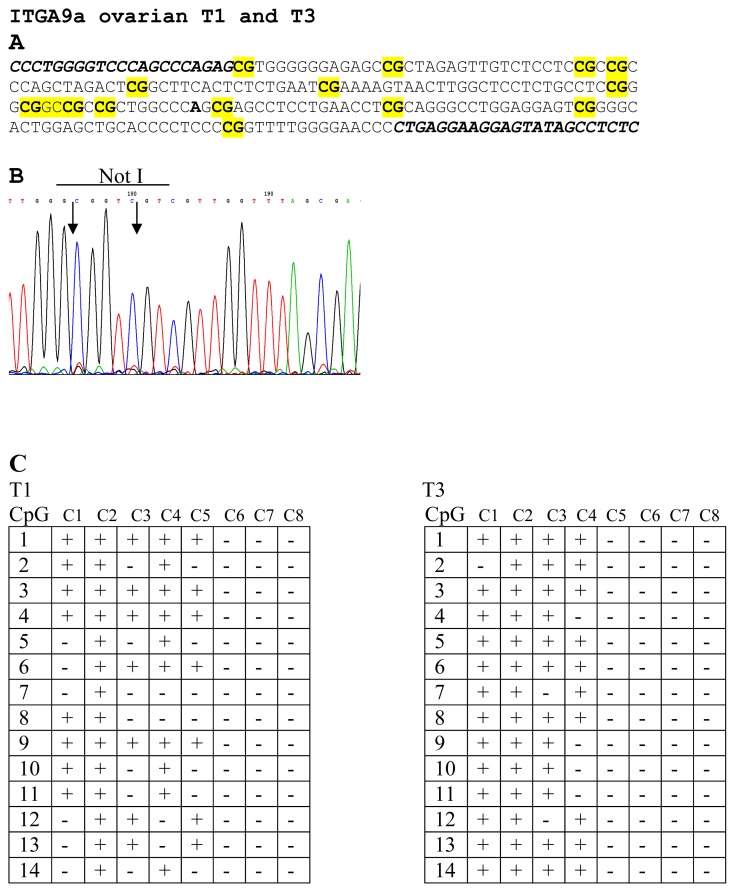
Figure 3.
Bisulfite sequencing of ITGA9 in EOC samples. CG-pairs containing methylated cytosine are shown in bold and yellow (A). Primers for bisulfite sequencing (A) are shown in italics below example of sequencing diagrams (B) demonstrating methylated sequence of ITGA9 is shown. In the two tables (C) methylated (+) and unmethylated (−) CG pairs are shown in eight sequenced clones for T1 and T3 samples.

