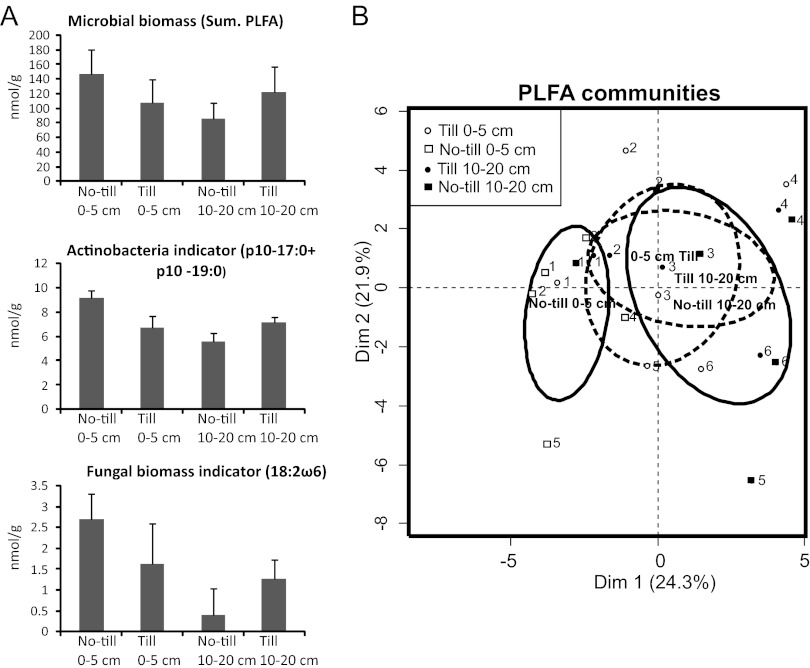
Fig 2.
PLFA analysis of microbial communities from six field sites (fields 1 to 6) with no-till and plowed soil (till) treatments. (A) Microbial biomass averages (sum of PLFAs) and actinobacterial (p10-17:0 plus p10-19:0) and fungal biomass (18:2ω6) indicators from the treatments (nmol g−1 ± standard deviation) (field sites 1 to 6 as replicates). (B) Principal-components analysis of PLFAs from six field sites. Confidence ellipses are drawn around the barycenters of till treatments (broken line) and no-till treatments (black line). The two dimensions explain 46.3% of the variance. The numbers in plots 1 to 6 represent the experimental fields described in Table 1.

