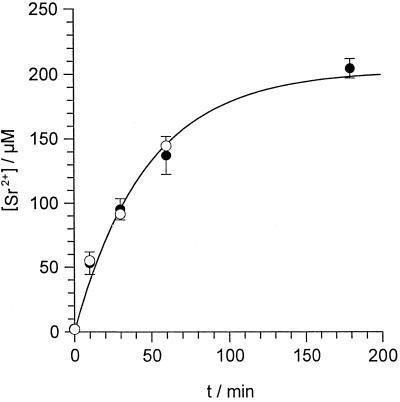
Figure 8.
Sr2+ uptake into E. viridis. Algal cells were incubated in the standard medium plus 1 mm SrCl2 either containing no ER Ca2+-ATPase inhibitor (control, •) or containing additionally 10 μm DBHQ or CPA (○). After different incubation times (t/min) cells were separated from the medium and the [Sr2+] of the cell sap ([Sr2+]/μm) was determined. Data points of the control (•) are given as means ± se of three to six measurements; data points measured in the presence of ER Ca2+-ATPase inhibitors (○) are means of three measurements. Data points were described by Equation 1. With an initial [Sr2+] of [Sr2+]0 = 2.1 μm, a fit to 19 separate data points for the control (•) yielded an equilibrium [Sr2+] of [Sr2+]EQ = 204 ± 18 μm, and a rate constant of a = 0.021 ± 0.004 min−1 (fit indicated by the solid line). When the data points measured in the presence of ER Ca2+-ATPase inhibitors (○) were included in the fit, parameters did not significantly change ([Sr2+]EQ = 202 ± 18 μm, a = 0.022 ± 0.004 min−1).

