
Fig 7.
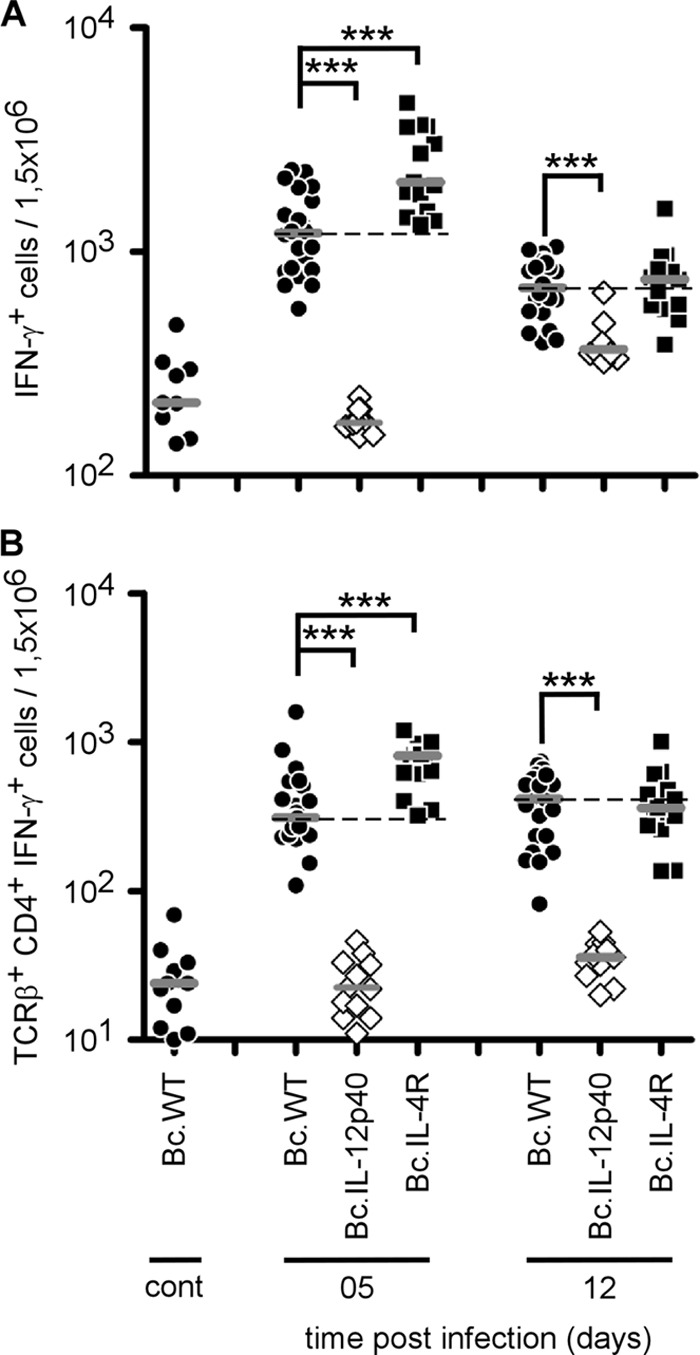
Flow cytometry analysis of IFN-γ-producing cells following B. melitensis infection. Wild-type, IL-12p40−/−, and IL-4R−/− BALB/c mice were injected i.p. with PBS (control) or 4 × 10⁴ CFU of B. melitensis and sacrificed at the indicated times. Spleen cells were collected and analyzed by flow cytometry. Cells were gated according to size and scatter to exclude dead cells and debris from analysis. Spleen cells from individual mice were first analyzed for forward size scatter versus IFN-γ production and then for cell surface markers. The frequency of IFN-γ-positive cells in uninfected deficient mice was similar to the one observed in uninfected wild-type mice. (A) Number of IFN-γ-positive cells per 1.5 × 10⁶ spleen cells acquired. (B) IFN-γ-positive cells were analyzed for T cell receptor β (TCRβ) and CD4 expression. The data represent the number of IFN-γ+, T cell receptor β-positive, and CD4+ cells from the groups described in panel A. Each piece of data represents the value obtained from an individual spleen, and the data are representative of two independent experiments. Gray bars represent the medians. ***, P < 0.001.