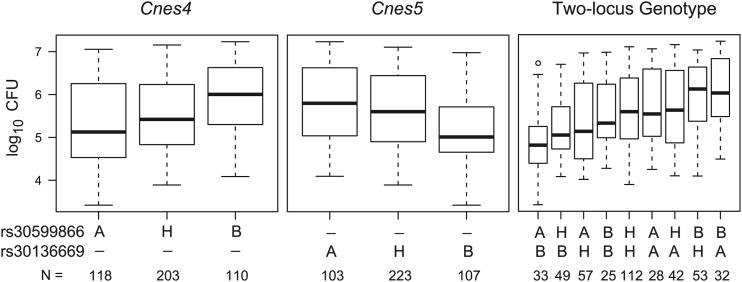
Fig 8.
Effect of Cnes4 and Cnes5 alleles on lung fungal burden following C. neoformans infection. Box plots of the numbers of CFU for the C3HCBAF2 mice are shown for the single-locus genotypes at the linkage peak of rs30599866 (Cnes4) and rs30136669 (Cnes5) and for the two-locus genotypes. The solid bar indicates the median; the bottom and top of each box represent the first and third quartiles, respectively; the whiskers extend 1.5 times the interquartile range; the open circle represents a single value beyond the whiskers. All pairwise comparisons of the single-locus genotypes indicate that mice homozygous for the CBA/J allele (B) are significantly different from mice homozygous for the C3H/HeN allele (A) and from heterozygous mice (H). Among all pairwise comparisons of the two-locus genotype groups, the three most resistant groups (for Cnes4-Cnes5, A-B, H-B, and A-H) are significantly different from the two most susceptible groups (B-H and B-A). In addition, the A-B genotype group is significantly different from the H-H, A-A, and H-A genotype groups (P value range, <0.05 to <0.001).

