
Fig 2.
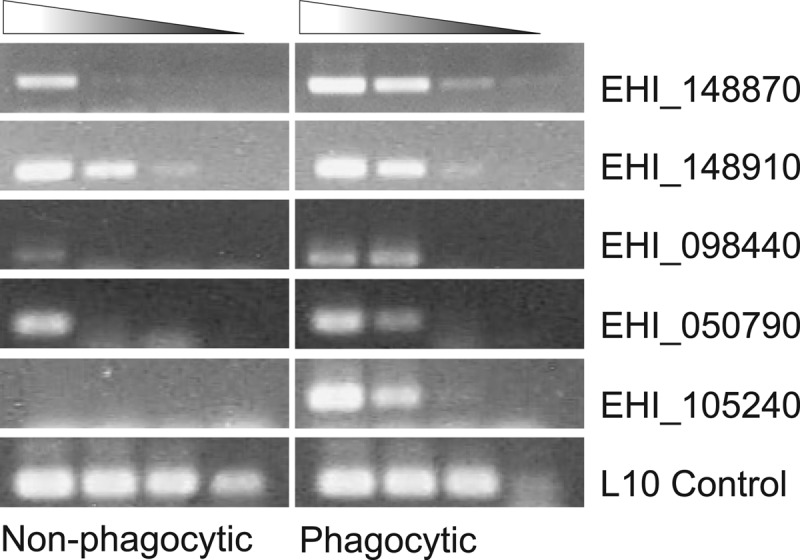
Semiquantitative RT-PCR showing the mRNA expression levels of five genes in nonphagocytic and phagocytic trophozoites and L10 rRNA control. cDNA from both nonphagocytic and phagocytic trophozoite populations was diluted 1:10, 1:100, 1:1,000, and 1:10,000 and used as the template for PCR. Ten-microliter volumes of each PCR product, loaded in order of increasing dilution from left to right, were assessed by agarose gel electrophoresis.