
Fig 3.
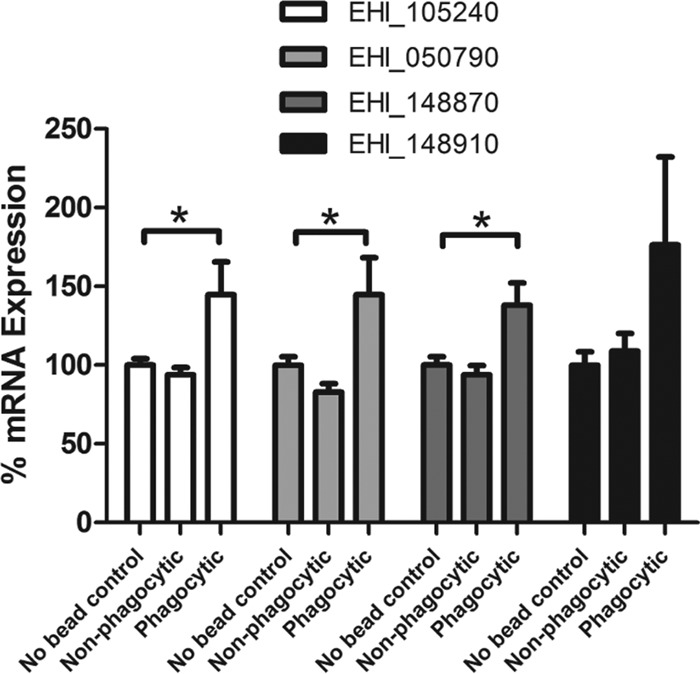
mRNA expression of selected genes from the sorted phagocytic and nonphagocytic subpopulations of E. histolytica compared to that in a no-bead control. Data are measurements from four different genes (EHI_105240, EHI_148910, EHI_148870, and EHI_050790) over 12 replicate experiments. qRT-PCR results were calculated by the ΔΔCT method and normalized to L10 rRNA (EHI_044810) (mean and standard error). Significance was tested by one-way analysis of variance with Dunnett's multiple-comparison test (*, P < 0.05).