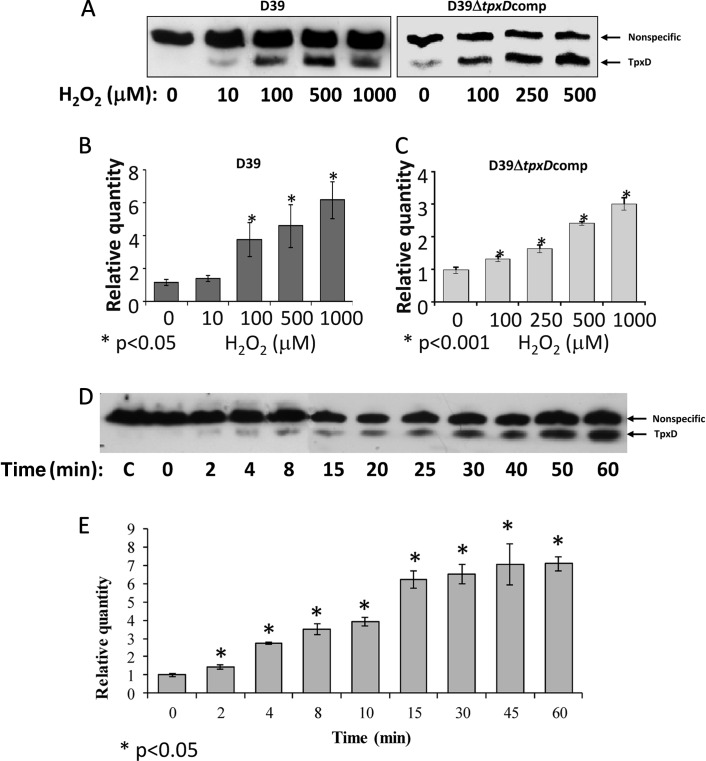
Fig 5.
Increased levels of tpxD expression and TpxD production following exposure to exogenous H2O2. TpxD production levels determined by Western blotting (A and D) and tpxD expression levels determined by real-time RT-PCR (B, C, and E) were measured in D39 and D39ΔtpxDcomp cells grown anaerobically to an OD620 of 0.3 in THY medium and then challenged with increasing H2O2 concentrations (10 to 1,000 μM) for 40 min (A to C) and in D39 cells challenged with 1,000 μM H2O2 for 2 to 60 min (D and E). C, control (D39 cells incubated with water [instead of H2O2] for 60 min). Values are representative of triplicate determinations for at least two independent experiments.

