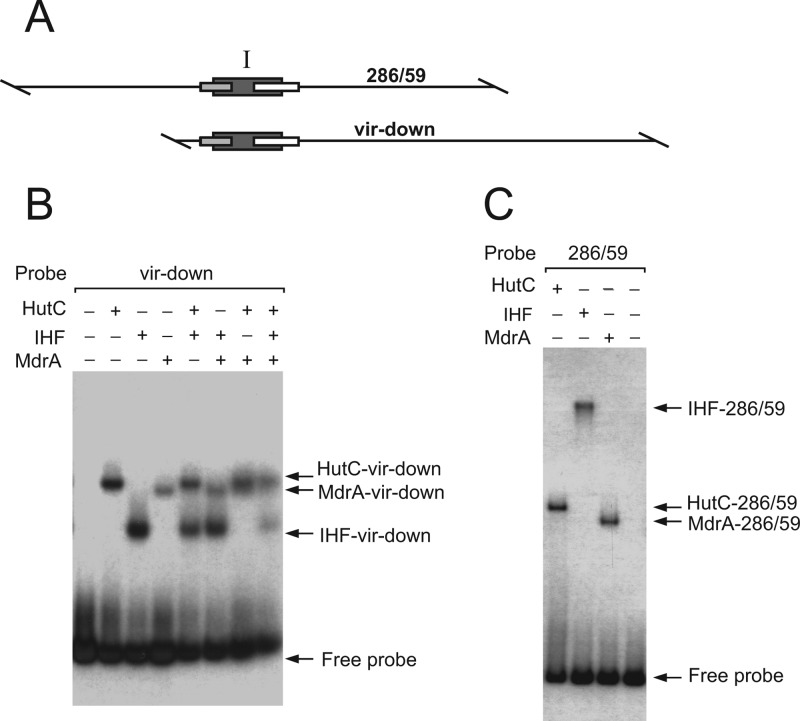
Fig 4.
Analysis of the interaction between MdrA, HutC, and/or IHF with the downstream region of the virB promoter. (A) Schematic representation of probes vir-down and 286/59. Rectangles indicate the positions of the binding sites of HutC, IHF, and MdrA. (B) Coincubation experiment performed by EMSA with probe vir-down and different combinations of 20 nM MdrA, 20 nM HutC, or 40 nM IHF. (C) Coincubation experiment performed by EMSA with probe 286/59 and different combinations of MdrA, HutC, or IHF. Protein concentrations were as described for panel B.

