
Figure 1. Leg and systemic haemodynamics during incremental single leg exercise.
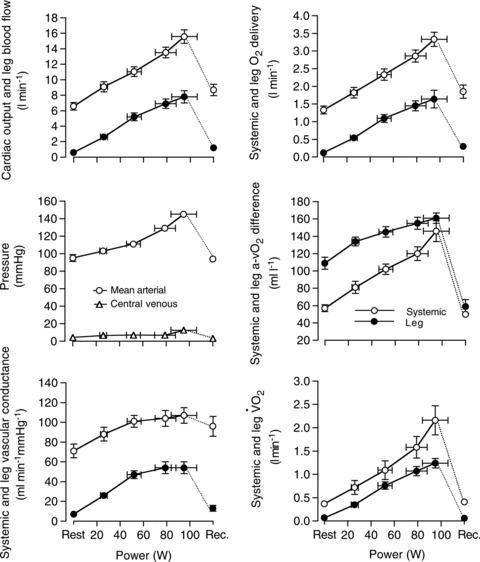
Cardiovascular variables were plotted against the increases in power output during single leg knee-extensor exercise. Note the similar rate of increase in leg O2 delivery and leg  (16 and 13 ml min−1 W−1, respectively). In all graphs, open circles represent the systemic responses and the filled circles represent the leg responses. Central venous pressure is depicted in empty triangles. Reproduced from González-Alonso et al. (2008).