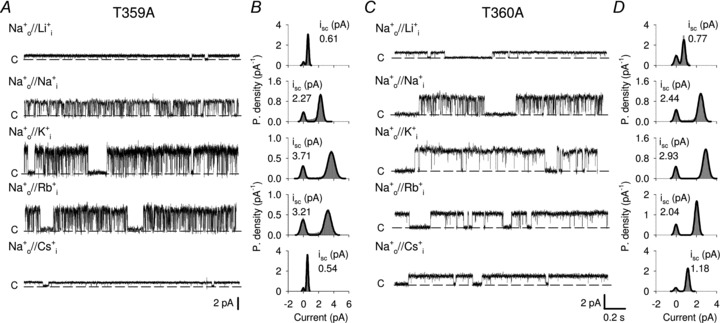
Figure 8. Single channel ionic selectivity in T359A and T360A mutant channels.

A, current recordings from one T359A mutant channel at +100 mV in the presence of 110 mm Na+ in the patch pipette and 110 mm Li+, Na+, K+, Rb+ and Cs+ in the bathing medium. Dashed lines indicate the closed state. Currents were elicited in the presence of 1 mm cGMP. B, all-point amplitude histograms from recordings in A. The continuous line represents a two component Gaussian fit. isc indicates the single channel current amplitude. C, as in A, but for T360A mutant channel. D, as in B, but for T360A mutant channel.
