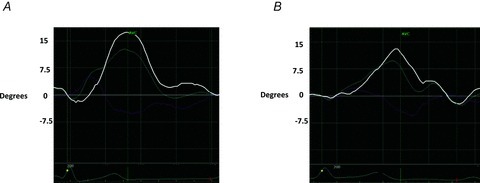
Figure 4. Representative example of left ventricular rotation and twist curves.

A, representative example of left ventricular twist (LVT) versus time curve at rest. B, LVT versus time curve from the same study subject at peak isometric handgrip testing, demonstrating reduced apical rotation (light blue curve) and LVT (white curve). Peak systolic apical rotation and LVT both occur earlier in the systolic ejection period at peak afterload. Light blue curve: apical rotation; pink curve: basal rotation; white curve: twist; AVC: aortic valve closure.
