Figure 2.
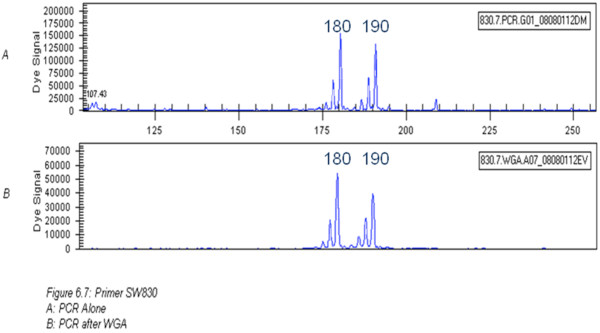
An example of capillary electrophoresis results before (graph A) and after (graph B) WGA. This confirms that no allele dropout or amplification bias occurred between the two steps as the peaks shown on the graphs are the same in both cases. In the case of amplification dropout, only one peak would be present in graph B.

