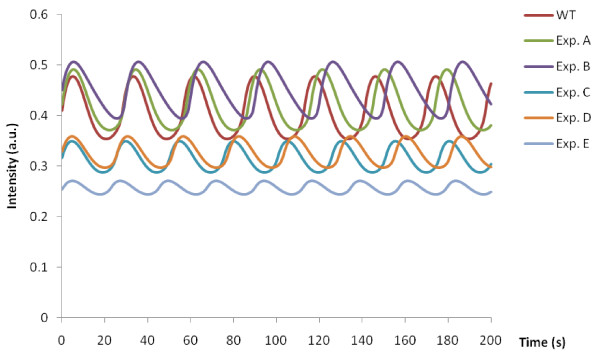
Figure 9.
Simulations of glycolytic oscillations as a result of changes to the GAPDH levels in the Wolf model of glycolysis. (A) - 50% reverse; (B) – 0% reverse; (C) – 50% forward; (D) – 50% forward and reverse; (E) – 30% forward. Resulting effects on parameter values are shown in Table 3.

