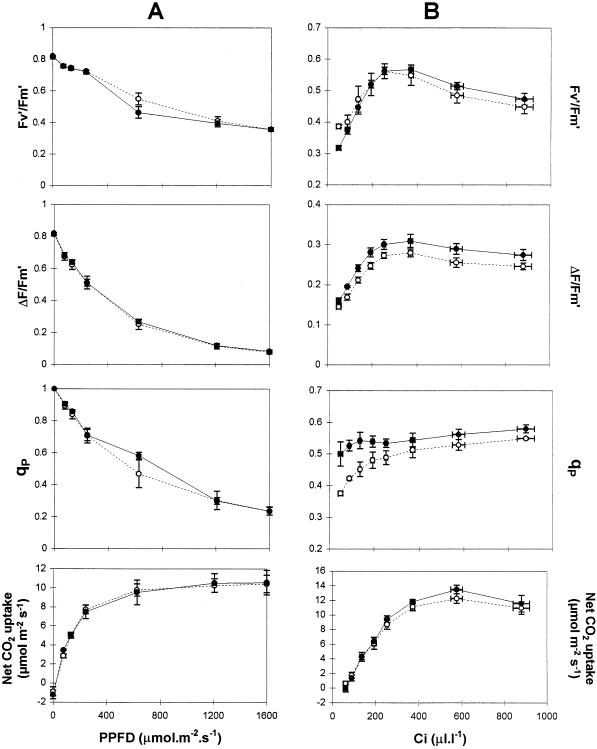
Figure 3.
Light (A)- and CO2 (B)-response curves for chlorophyll a fluorescence quenching parameters and net CO2 uptake by leaves from WT (○) and poplar overexpressing FeSOD (•). A, CO2 concentration was 350 μL L−1; B, PPFD was 590 μmol m−2 s−1. Values are means ± se of three (A) or four (B) individual plant measurements.

