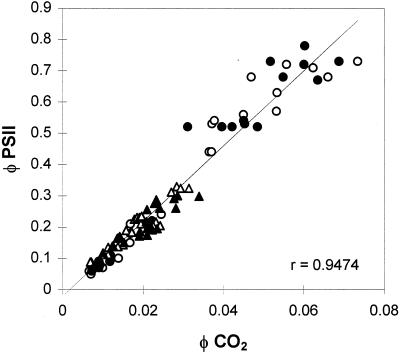
Figure 5.
The relationship between ΦPSII and ΦCO2 in WT (○, ▵) and poplar overexpressing FeSOD (•, ▴) measured under nonphotorespiratory conditions, 1% O2. Measurements were obtained with either varying irradiance (○, •) or varying CO2 partial pressures (▵, ▴). Each point represents an individual measurement.

