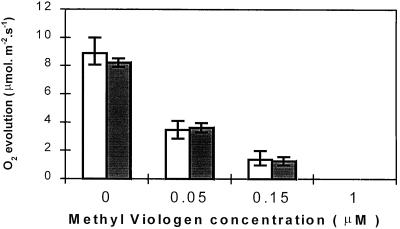
Figure 8.
CO2-dependent O2 evolution by leaf discs from WT (white bars) and poplar overexpressing FeSOD (gray bars) incubated overnight in the presence of different concentrations of MV and then illuminated for 30 min in high light (1100 μmol m−2 s−1) and saturated CO2 (5%). Values are the mean ± se of four separate experiments.

