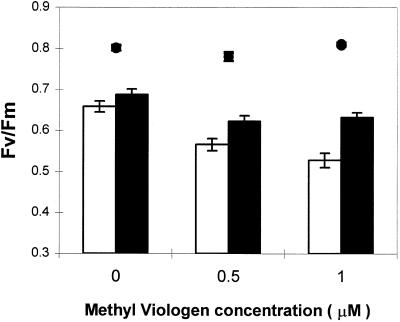
Figure 9.
Dark-adapted Fv/Fm ratios measured on leaf discs from WT (white bars) and poplar overexpressing FeSOD (black bars) incubated overnight in the presence of different concentrations of MV and then illuminated for 2 h in high light (1100 μmol m−2 s−1) and saturating CO2 (5%). Leaf discs were then allowed to recover in darkness for 2 h prior to Fv/Fm measurement. The Fv/Fm values measured at the end of the overnight incubation in water or MV (•) were compared with Fv/Fm values measured after 2 h of dark adaptation following exposure to high light (bars). Values are means ± se of six independent experiments.

