Fig 3.
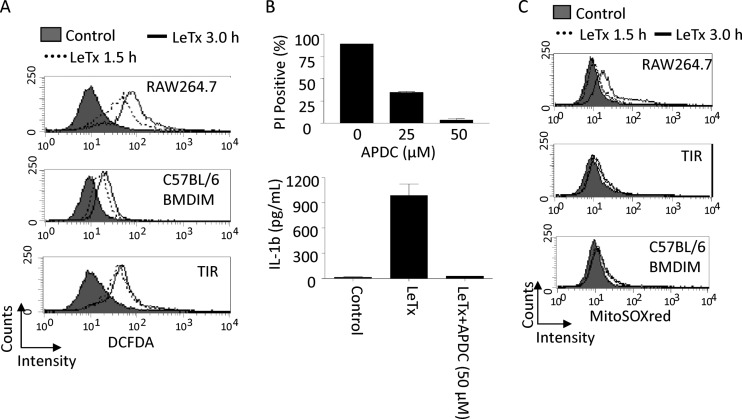
TIR cells are resistant to mitochondrial ROS production induced by LeTx. (A) Total cellular ROS productions was analyzed by flow cytometry using the ROS dye CM-H2DCFDA (5 [and 6]-chloromethyl-2′,7′-dichlorodihydrofluorescein, acetyl ester; DCFDA) as described in Materials and Methods. RAW264.7, TIR, or C57BL/6 BMDIM cells were incubated in the presence or absence of LeTx (500 ng/ml LF and 1 μg/ml PA) for the indicated times and stained with 5 μM DCFDA. Data are representative of more than three independent experiments. (B) RAW264.7 cells were pretreated with APDC for 30 min and treated with LeTx (500 ng/ml LF and 1 μg/ml PA) in the absence or presence of APDC for 5 h. Cell death was measured by flow cytometry using PI staining, and data were analyzed using Cellquest software (top). Data are expressed as means and SD (n = 3). RAW264.7 cells were pretreated with LPS (1 μg/ml) for 4 h and incubated in the absence or presence of ammonium pyrrolidine dithiocarbamate (APDC; 50 μM) for 30 min. Cells were further cultured with or without LeTx (500 ng/ml LF and 1 μg/ml PA) for 2 h. Cell culture supernatants were collected and used for IL-1β measurement. Levels of IL-1β were quantified by ELISA using an eBioscience ELISA kit. Data are expressed as means and SD (n = 3). (C) RAW264.7, TIR, or BMDIM (C57BL/6) cells were treated with LeTx as described above and were washed with prewarmed culture medium. Cells were then stained with 2.5 μM Mitosox red as described in Materials and Methods. Mitochondrial ROS generation was analyzed by flow cytometry using Cellquest software. Data are representative of three independent experiments.

