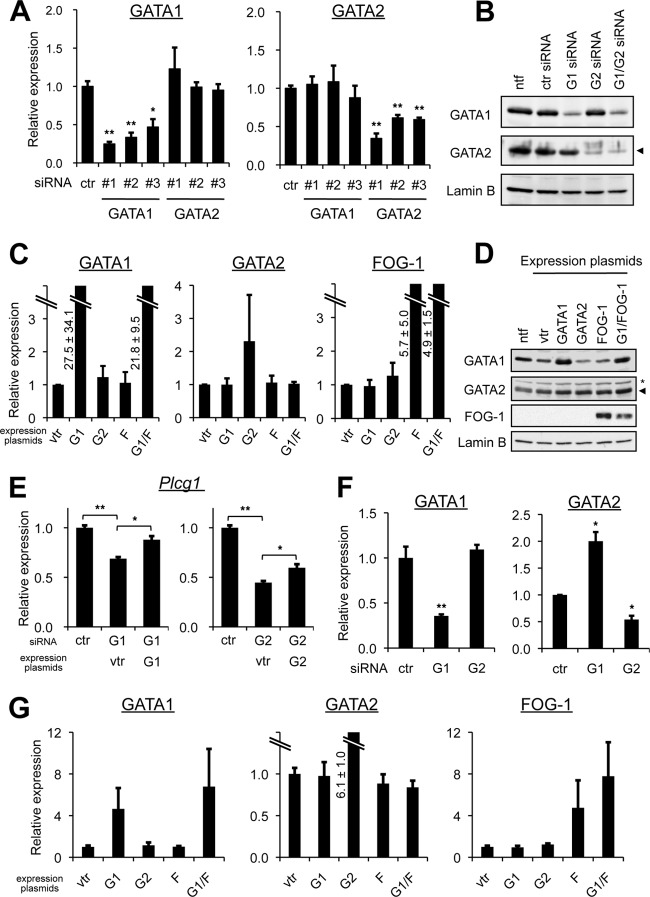
Fig 3.
Lack of cross-regulatory gene transcription of Gata1 and Gata2 in RBL-2H3 cells. (A) RBL-2H3 cells were transfected with one of three different siRNAs (1, 2, and 3) targeting GATA1 or GATA2 or with control siRNA (ctr), and the mRNA levels of GATA1 and GATA2 were examined by qRT-PCR. The value from the control siRNA-transfected cells was set to 1. *, P < 0.05, and **, P < 0.01 compared with the control. (B) The protein levels of GATA1, GATA2 (arrowhead), and lamin B (loading control) in RBL-2H3 cells transfected with GATA1 and/or GATA2 siRNA were examined by Western blot analysis. The representative results from 3 independent experiments are shown. For both GATA1 and GATA2, siRNA 1 (see panel A) was used. ntf, no transfection control. (C) mRNA levels of GATA1, GATA2, and FOG-1 in RBL-2H3 cells were determined by qRT-PCR. Cells were transfected with a control vector expressing GFP (vtr), GATA1, GATA2, or FOG-1 or cotransfected with GATA1 and FOG-1 (G1/F). The value from cells transfected with the control GFP expression plasmid was set to 1. (D) Cells transfected as described for panel C were subjected to Western blot analysis using anti-GATA1, anti-GATA2, anti-FOG-1, and anti-lamin B (loading control) antibodies. The representative results from 5 independent experiments are shown. The asterisk indicates a nonspecific band, and the arrowhead identifies GATA2. (E) The mRNA levels of PLC-γ1 in RBL-2H3 cells were determined by qRT-PCR. Cells were transfected with siRNA and/or with an expression plasmid, as indicated. The value from cells transfected only with control siRNA was set to 1. For both GATA1 and GATA2, siRNA 1 (see panel A) was used. For the comparisons indicated, *, P < 0.05, and **, P < 0.01. (F) mRNA levels of GATA1 and GATA2 in MEL cells transfected with GATA1 or GATA2 siRNA were examined by qRT-PCR. The value from the control siRNA-transfected cells was set to 1. *, P < 0.05, and **, P < 0.01 compared with the control. (G) mRNA levels of GATA1, GATA2, and FOG-1 in MEL cells were determined by qRT-PCR. The cells were transfected with a vector expressing GFP (control), GATA1, GATA2, or FOG-1 or cotransfected with GATA1 and FOG-1 (G1/F). For all qRT-PCR analyses, data were obtained from at least 3 independent experiments. G1, GATA1; G2, GATA2; F, FOG-1; vtr, control vector expressing GFP.

