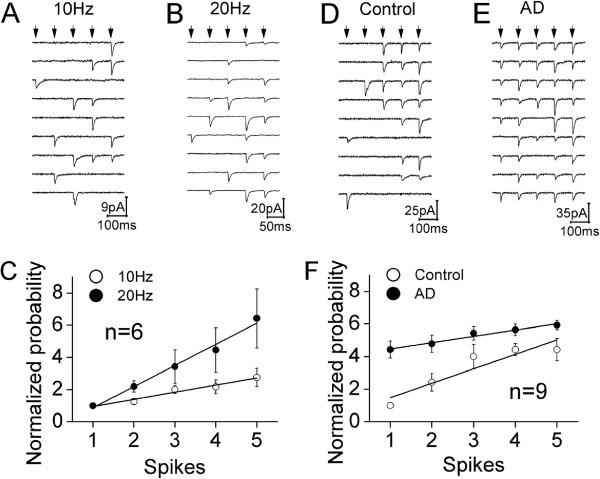
Figure 2.
The probability of releasing glutamates is up-regulated by spike frequency and presynaptic Ca2+. A) shows the waveforms of uEPSC1 ~ 5 induced by five sequential spikes (arrows) with 10 Hz in frequency at a synapse. Calibration bar, 9 pA/100 ms. B) shows the waveforms of uEPSC1 ~ 5 induced by five sequential spikes (arrows) with 20 Hz in frequency at this synapse. Calibration bar, 20 pA/50 ms. C) shows the comparisons of the normalized probabilities of releasing glutamates by five spikes in frequencies at 10 Hz (opened symbols) vs. 20 Hz (filled symbols; n = 6). D) shows the waveforms of uEPSC1 ~ 5 induced by five sequential spikes (arrows) under the control at a synapse. Calibration bar, 25 pA/100 ms. E) shows the waveforms of uEPSC1 ~ 5 induced by five sequential spikes (arrows) under adenophostin-A (AD) infusion at a synapse. Calibration bar, 35 pA/100 ms. F) shows the comparisons of the normalized probabilities of releasing glutamates by five spikes under control (opened symbols) vs. AD infusion (filled symbols; n = 9). Lines in C and F illustrate linear dynamical fitting.

