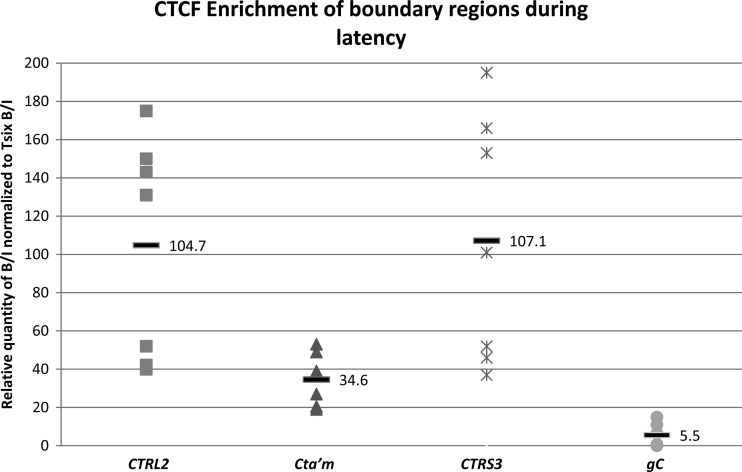
Fig 3.
CTCF occupation of three CTCF binding motifs in HSV-1 during latency in mouse TG. ChIP data are presented as a ratio of the relative numbers of copies of the PCR target in two fractions (B/I), where the bound fractions are representative of aliquots incubated overnight with the antibody anti-CTCF and the input fractions are representative of the total DNA present. All PCR was performed on a single-color MyiQ real-time PCR Detection System Version 2 (Bio-Rad). Standard curves were generated for each gene region analyzed using purified HSV-1 DNA or purified mouse DNA. Relative copy numbers in the B or I fractions of ChIP samples were determined from the equation for the standard curve specific to the primer-probe set used. Prior to real-time PCR analyses of viral targets, all ChIP assays were validated by determining the B/I ratios of the cellular controls Tsix imprinting/choice center CTCF site A (positive control) and MT498 (negative control). Each data point represents a normalized B/I ratio for 3 mice (6 TG pooled). Each time point contains a minimum of 6 data points (n = 6). All relative B/I ratios from each gene region were normalized to the B/I ratio for the cellular control Tsix site A B/I for that ChIP assay. The horizontal bars represent the average normalized B/I ratios for a given gene region from all ChIP assays at that time point. Statistical data were determined by one-way analysis of variance by comparing the normalized B/I ratios of each gene region to the normalized B/I ratio for the negative control, gC. All three sites analyzed were significantly enriched in CTCF relative to gC.

