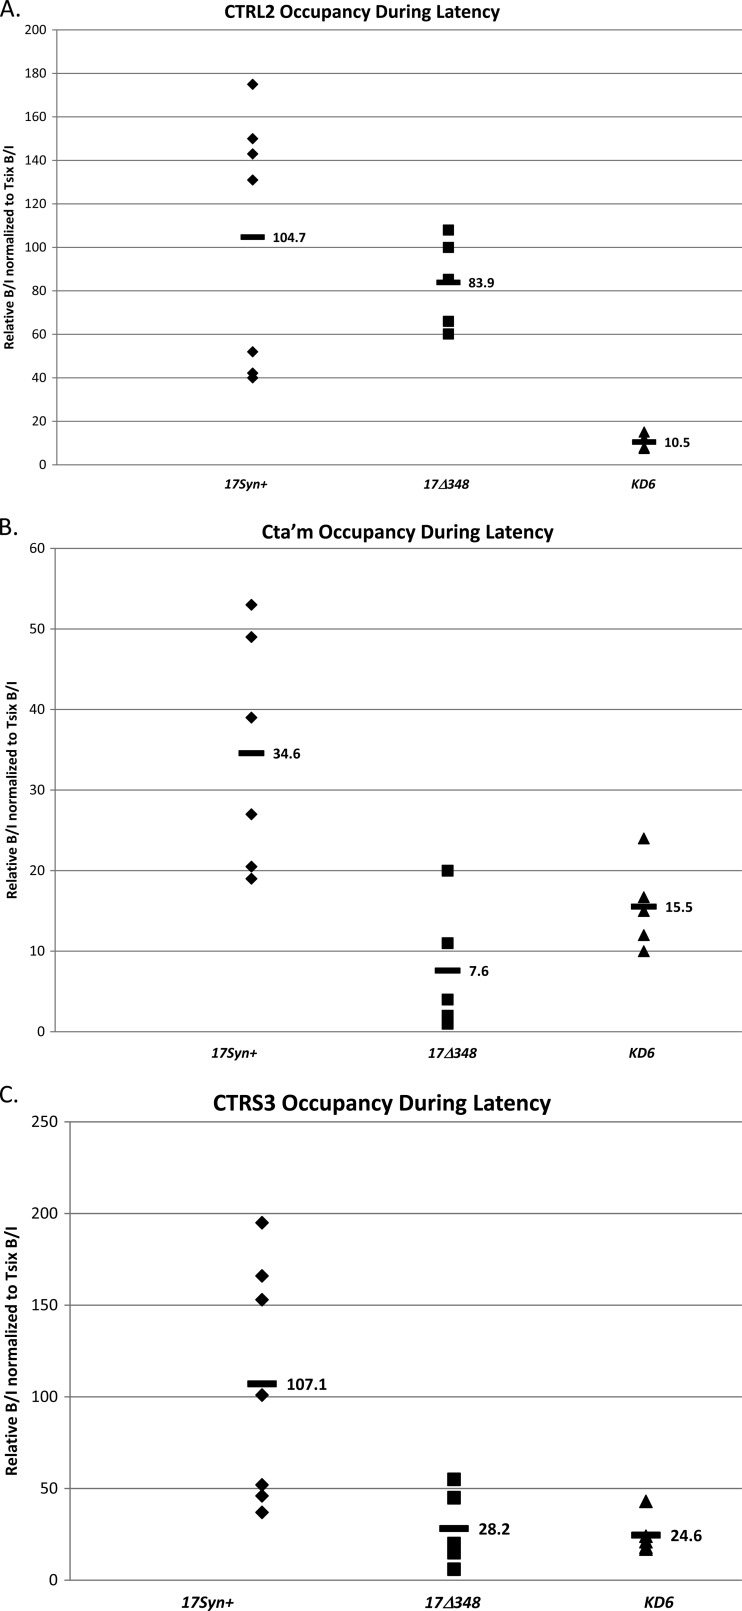
Fig 9.
CTCF occupation of CTRL2, CTa′m, and CTRS3 during latency in viruses. ChIP data are presented for each site during latency for comparison of the three viruses used. All ChIPs were validated as described in Materials and Methods. Each data point represents a normalized B/I ratio for 3 mice (6 TG pooled). Each time point contains a minimum of 5 data points (n = 5). All relative B/I ratios from each gene region were normalized to the B/I ratio for the cellular control Tsix site A B/I for that ChIP assay. The horizontal bars represent the average normalized B/I ratios for a given gene region from all ChIP assays at that time point. Statistical data were determined by one-way analysis of variance by comparing the normalized B/I ratio of each gene region to the normalized B/I ratio for 17Syn+. (A) CTRL2 occupation during latency. No statistical difference was found between CTCF occupation of 17Δ348 and 17Syn+ (P > 0.1). (B) CTa′m occupation during latency. There was a 2-fold reduction in CTCF bound to the site in KD6 and a 4-fold reduction in 17Δ348 during latency compared to the wild type (P < 0.02 and P < 0.005, respectively). (C) CTRS3 occupation during latency. Both recombinants have ∼4-fold lower CTCF occupation at this site during latency than the wild type (P < 0.05).

