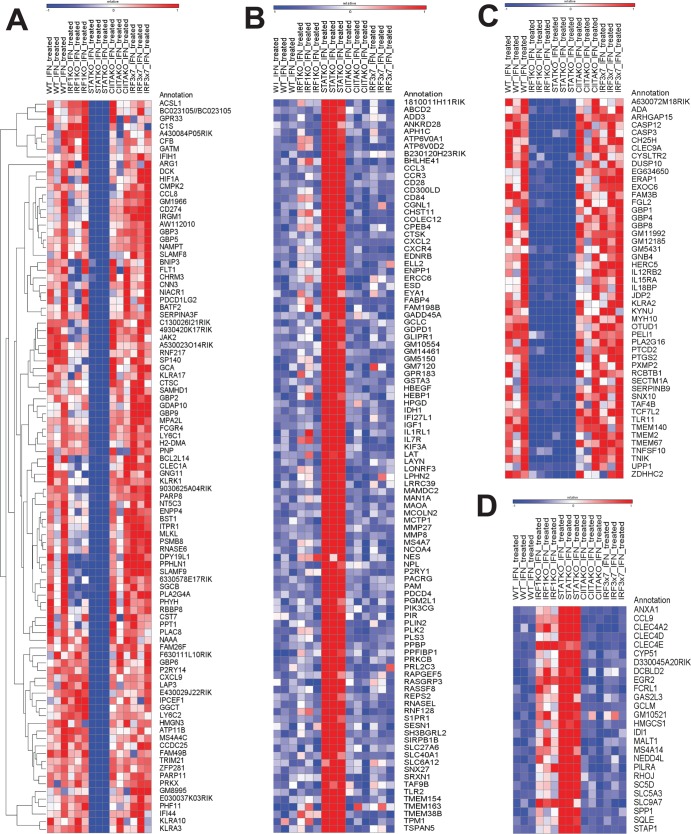
Fig 6.
Heat maps of the genes assigned to group A (A), group B (B), group C (C), and group D (D) by microarray analyses (see Table 2). Group A represents genes that are upregulated by IFN-γ in a STAT-1-dependent manner, group B represents genes that are downregulated by IFN-γ in a STAT-1-dependent manner, group C represents genes that are upregulated by IFN-γ in an IRF-1- and STAT-1-dependent manner, and group D represents genes that are downregulated by IFN-γ in an IRF-1- and STAT-1-dependent manner. The heat maps represent row-normalized Z-score values per gene. Expression values of >1 standard deviation above the expression level in untreated WT macrophages are indicated in red, and values of >1 standard deviation below the WT expression level are indicated in blue.

