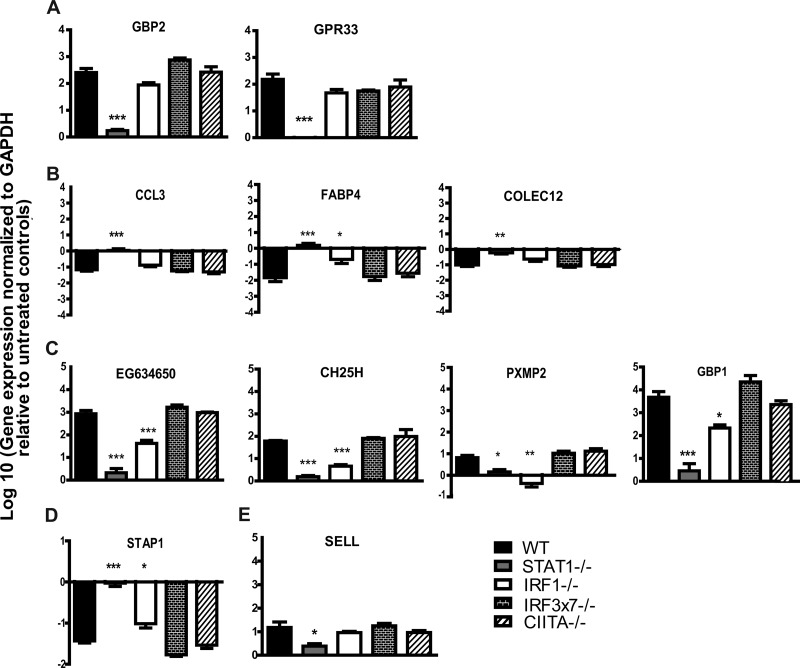
Fig 7.
Validation of microarray analyses by qRT-PCR. WT, IRF-1−/−, CIITA−/−, IRF3×7−/−, and STAT-1−/− macrophages were treated with 10 U of IFN-γ or with medium alone. Transcription levels of select genes were examined after 12 h of treatment. Data were collected from three independent experiments. Genes assigned to group A (A), group B (B), group C (C), group D (D), and group E (E) by microarray analyses (see Table 2) were examined. Asterisks indicate significant differences in transcript levels relative to those in WT cells (*, P < 0.05; **, P < 0.01; ***, P < 0.001).

