Fig 6.
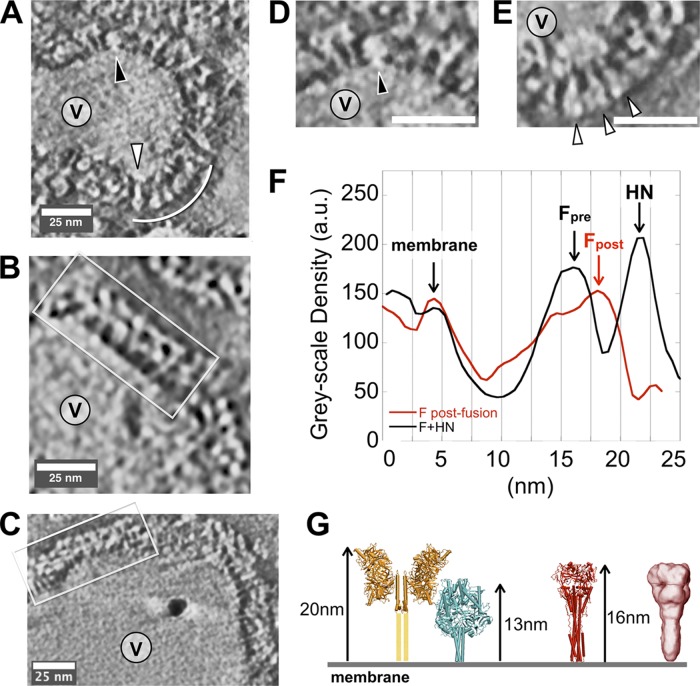
Negative-stain electron microscope tomography of HPIV3 virus particles. (A) A subpopulation of small particles (V, virus interior) bear predominantly F proteins in postfusion conformation (white arc and carat), with some F in prefusion form (black carat). (B and C) The majority of typical particles in our preparations show a double-layered surface (white box), with little postfusion F observed. (D) Close-up of the upper region of the particle shown in panel A. (E) Close-up of the lower region of the particle in panel A. (F) Average radial density plots show clear differences between regions of primarily F in postfusion conformation (red) and the more typical double-layer coat on most particles (black). (G) Models and dimensions for coupled HN/F and postfusion F based upon reported crystal structures (28, 42, 67–69) (yellow, HN; cyan, prefusion F; red, postfusion F) and a cryo-negative stain electron microscopy reconstruction for postfusion F (red density) (32). au, arbitrary units.

