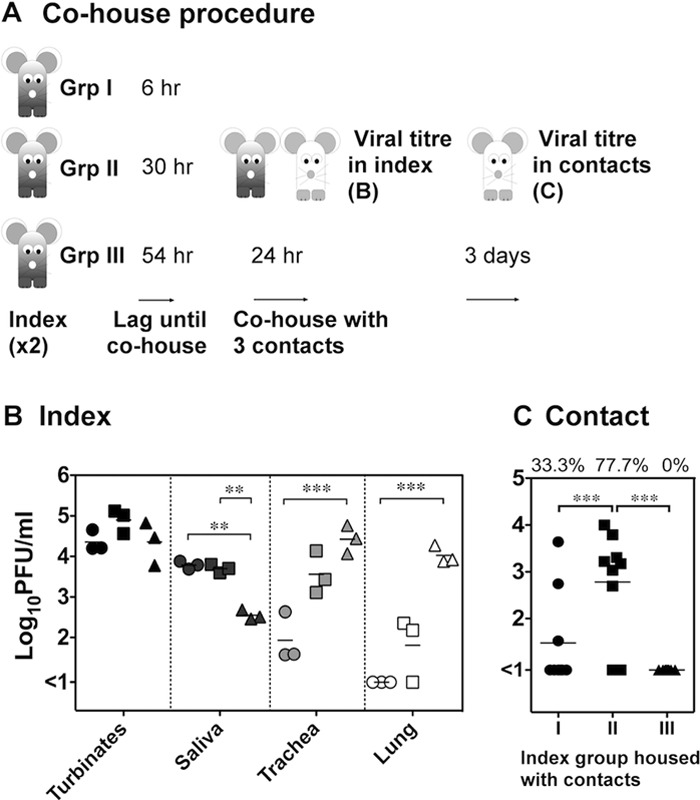
Fig 3.

Period of transmission and its association with viral load in index mice. (A) Index mice were infected with 104.5 PFU of A/Udorn/307/72 via the upper respiratory tract, and 6 h (Group I [Grp I]), 30 h (Group II), or 54 h (Group III) later index mice were introduced to contacts. Following 24 h of cohousing, the viral load in the nasal turbinates, saliva, trachea, and lung of the index mice were measured. (B) Titers of two index mice that were cohoused in the same experiment were averaged, and the means and standard deviations of these values for three separate experiments are shown for each index group. Group I, circles; Group II, squares; Group III, triangles. (C) Three days after the cohousing period, respiratory tissues were sampled from the contacts to measure viral load. The viral titers in the nasal turbinates of each contact (n = 9) exposed to the respective index group and the percentage of contacts that became infected after cohousing (at the top) are shown. Significant differences are indicated by brackets and were determined by two-way ANOVA with a Bonferroni posttest. **, P < 0.01; ***, P < 0.001.
