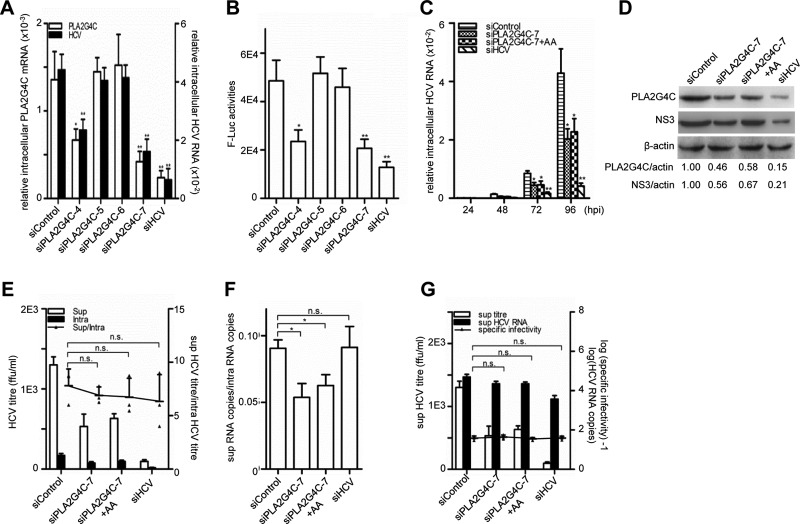
Fig 2.
The knockdown of PLA2G4C decreases HCV replication. Huh7.5.1 cells were pretransfected with 20 nM siRNA for 48 h before being infected with HCV J399EM or HCV JFH1-luc (MOI = 0.1). (A) The relative intracellular PLA2G4C mRNA levels and HCV RNA levels in cells infected with J399EM were examined by quantitative RT-PCR at 96 h.p.i. (B) The luciferase activity in cells infected with HCV JFH1-luc were measured at 96 h.p.i. (C) The cells infected with J399EM after siRNA transfection were then either treated or not with arachidonic acid (AA) (50 μM). The relative intracellular HCV RNA levels were examined by quantitative RT-PCR at the indicated time points. (D) Whole-cell lysates were collected for Western blot analysis for HCV NS3 and β-actin at 96 h.p.i. PLA2G4C was concentrated by IP and then detected by Western blot assay using an anti-PLA2G4C antibody. The protein levels were quantified by densitometry, normalized against beta-actin, and expressed in arbitrary units. (E to G) The intracellular (intra) and supernatant (sup) HCV titers and the intracellular and supernatant HCV RNA levels at 96 h.p.i. were measured. The budding efficiency (sup HCV titer/intra HCV titer) (E), the assembly efficiency (sup HCV copies/intra HCV copies) (F), and the specific infectivity in the supernatant (sup HCV titer/sup HCV copies) (G) were calculated. The bars indicate the standard deviations of triplicates. The statistically significant differences of the different groups (referred to as sup/intra or specific infectivity in panels E to G) are shown as * (P < 0.05), ** (P < 0.01), and n.s. (no significant difference). ffu, focus-forming units.

