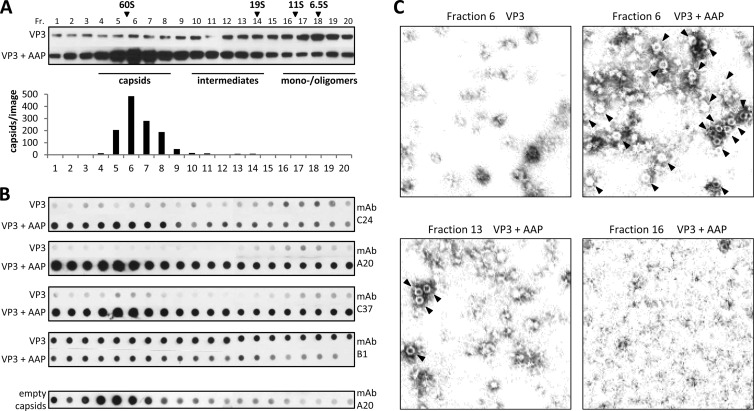
Fig 7.
Analysis of VP3 conformations in the presence or absence of AAP. (A) Western blot analysis of sucrose density gradient fractions (Fr. 1 to 20) of lysates from 293T cells expressing VP3 alone or in combination with AAP. VP3 was detected using MAb B1. The same amount of each fraction was analyzed under the same conditions. A reference gradient with purified proteins with known S values was used for calibration. The distribution of assembled AAV2 capsids (number of capsids per image) was analyzed by quantification of at least three representative electron microscopy images from each gradient fraction. (B) Native dot blot analysis of sucrose density gradient fractions from cell lysates containing VP3 or VP3 and AAP, respectively. The same amount of each fraction was dotted onto nitrocellulose membranes under the same nondenaturing conditions and detected by the capsid-specific antibodies C24, A20, and C37 or the B1 antibody, which is specific for a linear epitope at the VP3 C terminus, in order to draw conclusions about AAP-induced conformational changes. The distribution of purified empty AAV2 capsids served as a control. (C) Electron microscopy images of sucrose density gradient fractions containing VP3 alone (fraction 6) or in combination with AAP (fractions 6, 13, and 16). Capsids are indicated by arrowheads.

