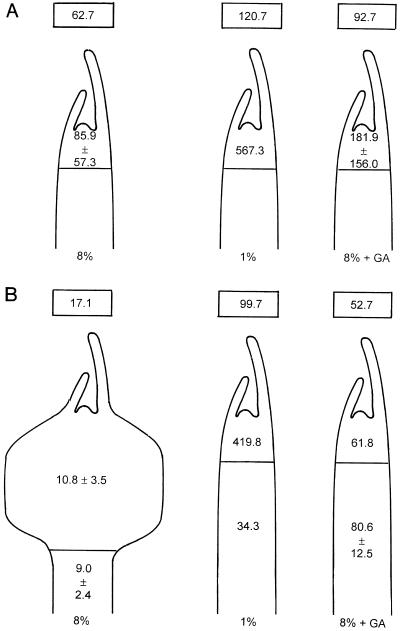
Figure 5.
Localization of GA1 in various regions of developing stolons of potato cuttings cultured under tuber-inducing (8% Suc) and -noninducing conditions (1% Suc and 8% Suc plus GA4/7) at d 4 (A) and at d 10 (B). The data inside of the drawings indicate GA1 concentrations (ng g−1) in those regions. The data in the boxes above the drawings are derived from Figure 4 and represent GA1 levels (ng g−1) in the whole developing stolon. Data are averages of duplicate measurements on samples from a single series of experiments, unless the amount of tissue was insufficient for replication.

