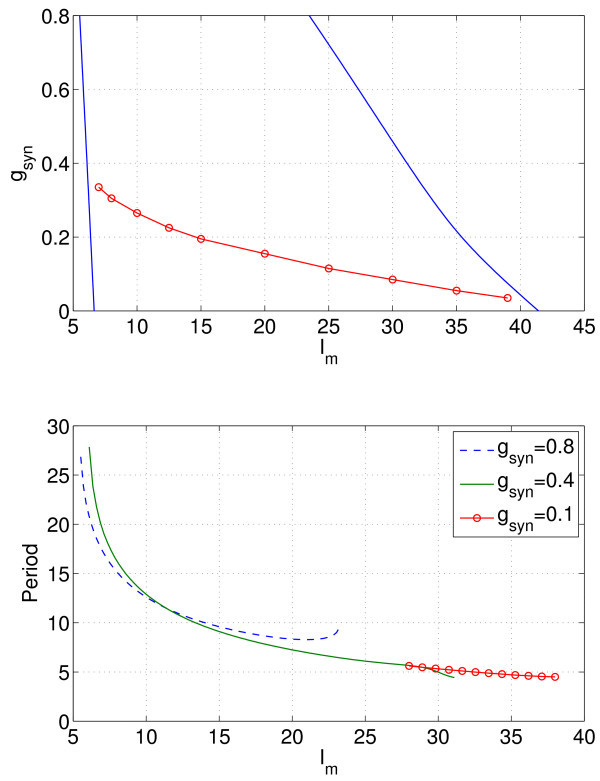
Fig. 10.
Hopf bifurcation curves and period of the stable periodic orbit for three different values of . Top: Hopf bifurcation curves (solid) and the curve on which the periodic orbit created in the rightmost Hopf bifurcation loses stability (circles, obtained by direct simulation). Synchronous oscillations occur only above the curve shown with red circles. Bottom: period of the stable periodic orbit for three different values of . The curve for is terminated at low when the periodic orbit loses stability to a more complex oscillation. , .

