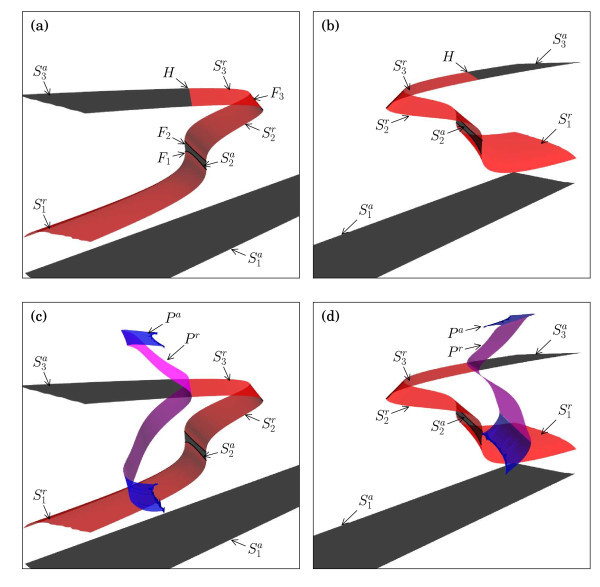
Fig. 4.
Critical manifolds for embedded in the five-dimensional phase space of system (1). Shown are projections onto the -coordinates; panels (a) and (b) show two different viewpoints of the surfaces of equilibria, coloured black when stable and red when not; from the same viewpoints, panels (c) and (d) also show maxima and minima with respect to V of the two-parameter families of periodic orbits, coloured blue when stable and magenta when not. The equilibrium manifold splits into six sheets, labelled , , , , and , that are separated by four fold curves, (not shown), , and , and a curve of Hopf bifurcations labelled H. The saddle and attracting families of periodic orbits are labelled and , respectively. See also Table 2.

