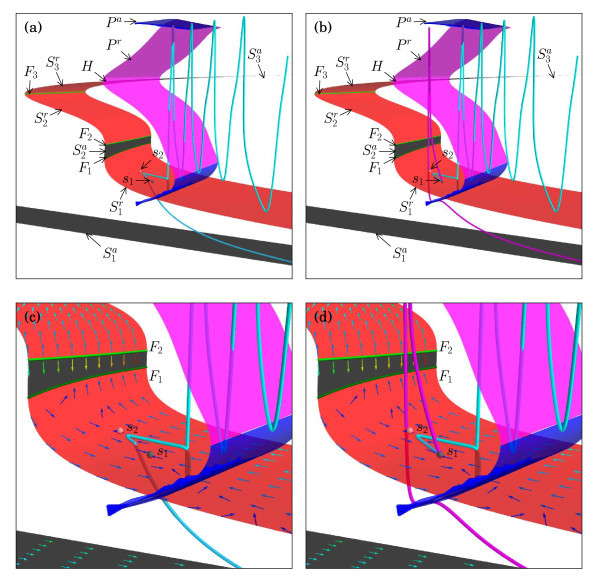
Fig. 9.
The critical manifold calculated for and projected onto ()-space. Superimposed in the left and right column are orbit segments with selected from the falling and rising slopes of the downward peak, respectively. Panels (a) and (b) show an overall view, and panels (c) and (d) are enlargements near and along with the associated slow flow. The two unstable equilibria and of the full system are marked with black and red dots because they are an attractor and a saddle on , respectively.

