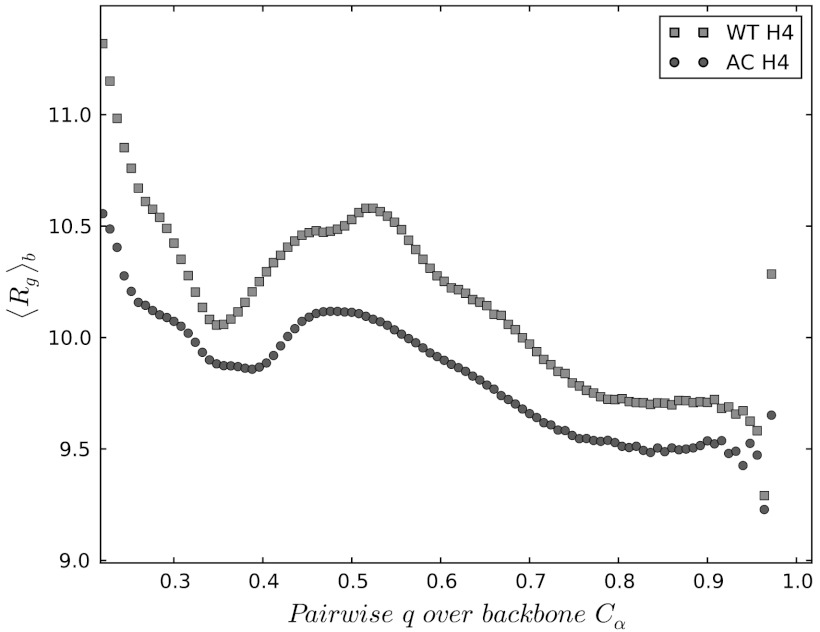
Fig. 3.
The dependence of the block-averaged Rg on the pairwise q values. The used block size is δq = 0.025, which corresponds to > 103 configurations in each block. The robustness of results was tested by varying the block sizes in the range of δq = 0.01 - 0.1, which yields quantitatively similar plots to the one shown on the present figure. The confidence intervals are estimated to be in the range of +/-3% with respect to the mean.

