Fig. 3.
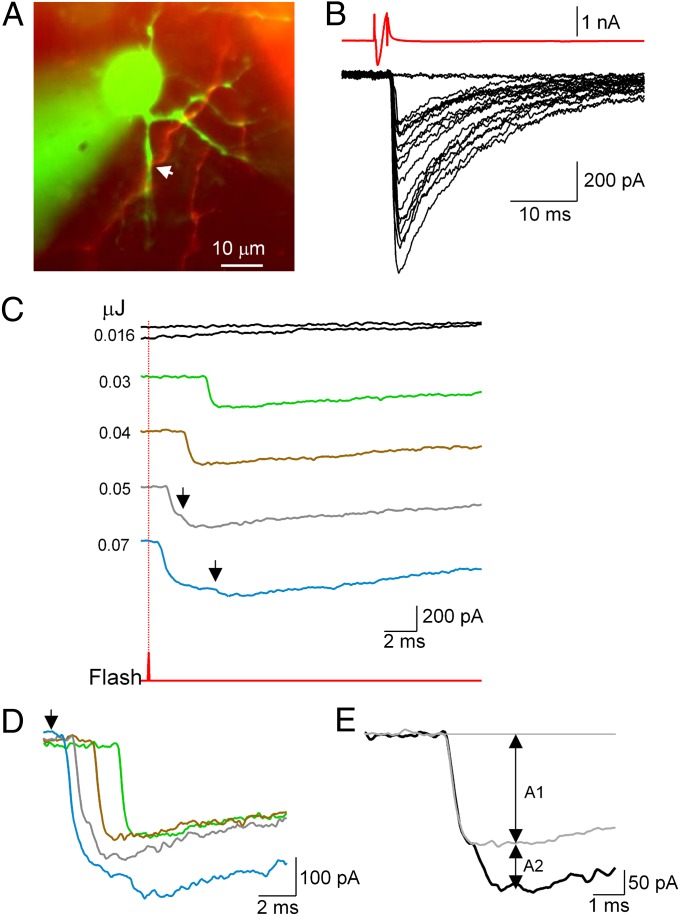
Superposition of quantal responses at high laser energy. (A) Image of synaptically connected presynaptic (red) and postsynaptic (green) MLIs (Movie S5). (B) Presynaptic APs elicit large PSCs. (C) Laser stimulation at varying energies. Laser timing is indicated by the lower trace (red), and position is shown by the arrow in A. Stimulation order: 0.016/0.05/0.03/0.016/0.04/0.07 μJ. Responses are quantal, with variable latencies after the laser pulse. Note the sublinear amplitude summation in multiple responses. (D) Superimposition of traces to show latencies; laser timing is indicated by the arrow. The blue trace may represent an unresolved double event (latency of 0.5 ms) followed by a late event (latency of 4.5 ms). (E) Analysis of compound PSC (0.05-μJ stimulus, black trace) as a superimposition of quantal responses with amplitude A1 (light gray trace, average of two single quantal responses) and a delayed quantal response with amplitude A2. The receptor occupancy by the single quantal response is calculated as 1 − A2/A1, giving 0.58 in the present case.

