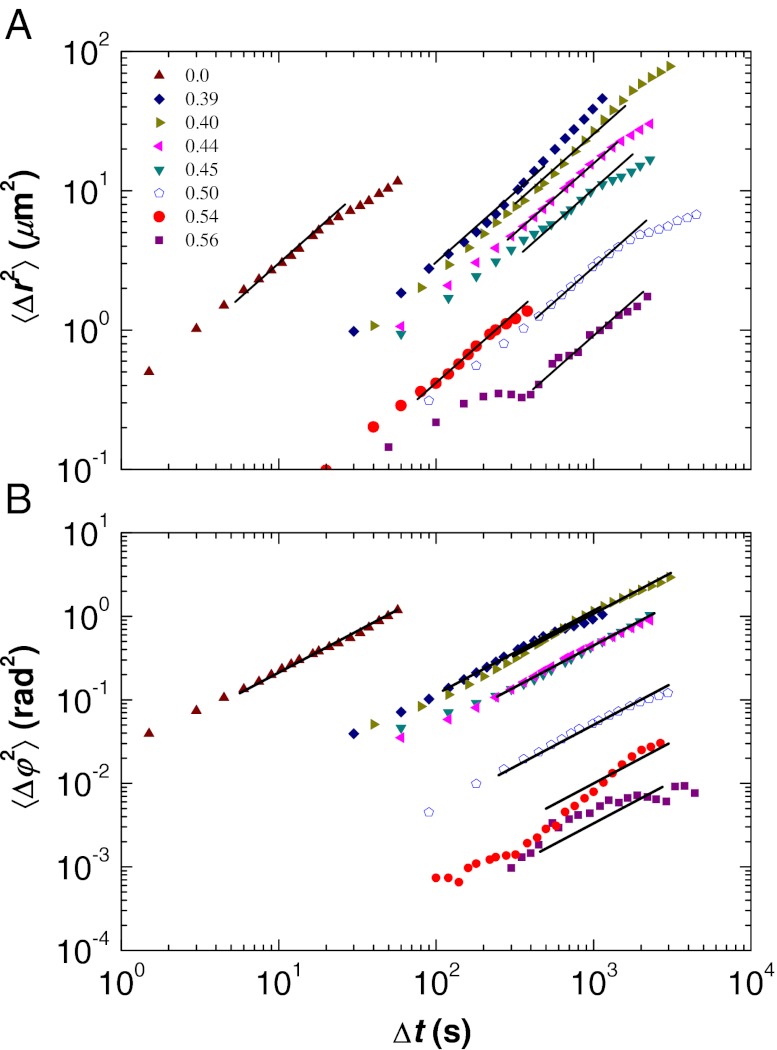
Fig. 3.
Translational and rotational mobility for range of volume fractions ϕ. (A) MSD 〈Δr2(Δt)〉. (B) MSAD 〈Δφ2(Δt)〉. The open symbols are from a pentamer cluster, the closed symbols are from tetrahedra. The solid straight lines show a slope of 1 and indicate the measured value of DT or DR. Uncertainty due to optical noise varies between each data set: Data for ϕ ∼ 0.56 are noisier than for ϕ ∼ 0.50 and 0.54. Data below the noise floor are not plotted (38). The deviations from slope = 1 seen at large Δt values are due to lack of data; this is discussed in Materials and Methods.

