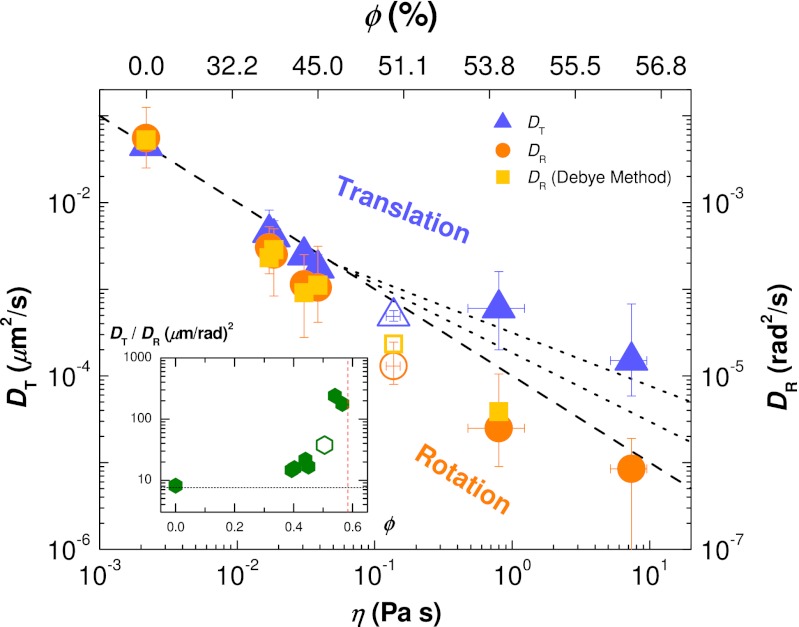
Fig. 4.
Diffusion coefficients of tracer clusters for different η and ϕ. The values of η (Lower) are interpolated from the data published in ref. 43 using our own ϕ values (Upper). Both vertical axes have the same scale but have been shifted to overlap the coefficients at ϕ = 0.0. Blue triangles: translational diffusion coefficients DT (Left axis). Orange circles: rotational diffusion coefficients DR (Right axis). Open symbols: data from a pentamer, n = 5 particles arranged as a triangular dipyramid (33). Light orange squares: rotational diffusion coefficients calculated using the Debye formalism. Dashed and dotted lines show, from bottom up, η−1, η−0.87, and η−0.73 dependencies. (Inset) Ratio between diffusion coefficients. The horizontal dashed line is the zero-concentration diffusivity ratio  , where a is the tetrahedral cluster’s effective radius, and the vertical line is ϕG ∼ 0.58.

