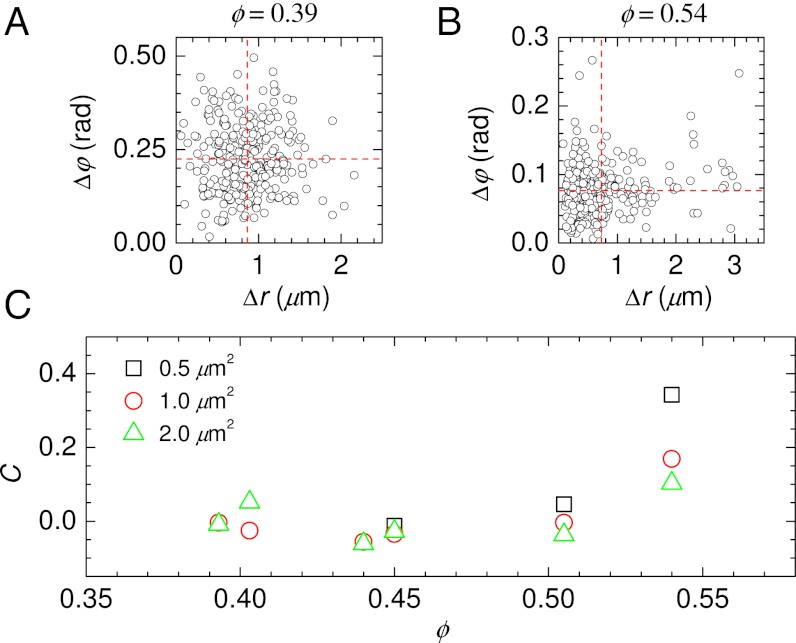
Fig. 6.
Correlations between translational and rotational displacements. (A) Scatter plot of Δr and Δφ, for ϕ = 0.393, 〈Δr2〉 = 1.0 μm2, Δt = 35 s. Δφ corresponds to the total rotation over each time interval. Horizontal and vertical dashed lines indicate the mean value of each type of displacement. (B) Similar for ϕ = 0.540, 〈Δr2〉 = 1.0 μm2, Δt = 181 s. (C) Correlation between Δr and Δφ as a function of volume fraction, using Δt defined such that 〈Δr2〉 has the value indicated by the legend. For low ϕ, we do not take data quickly enough to see 〈Δr2〉 = 0.5 μm2, so no values are plotted in such cases.

