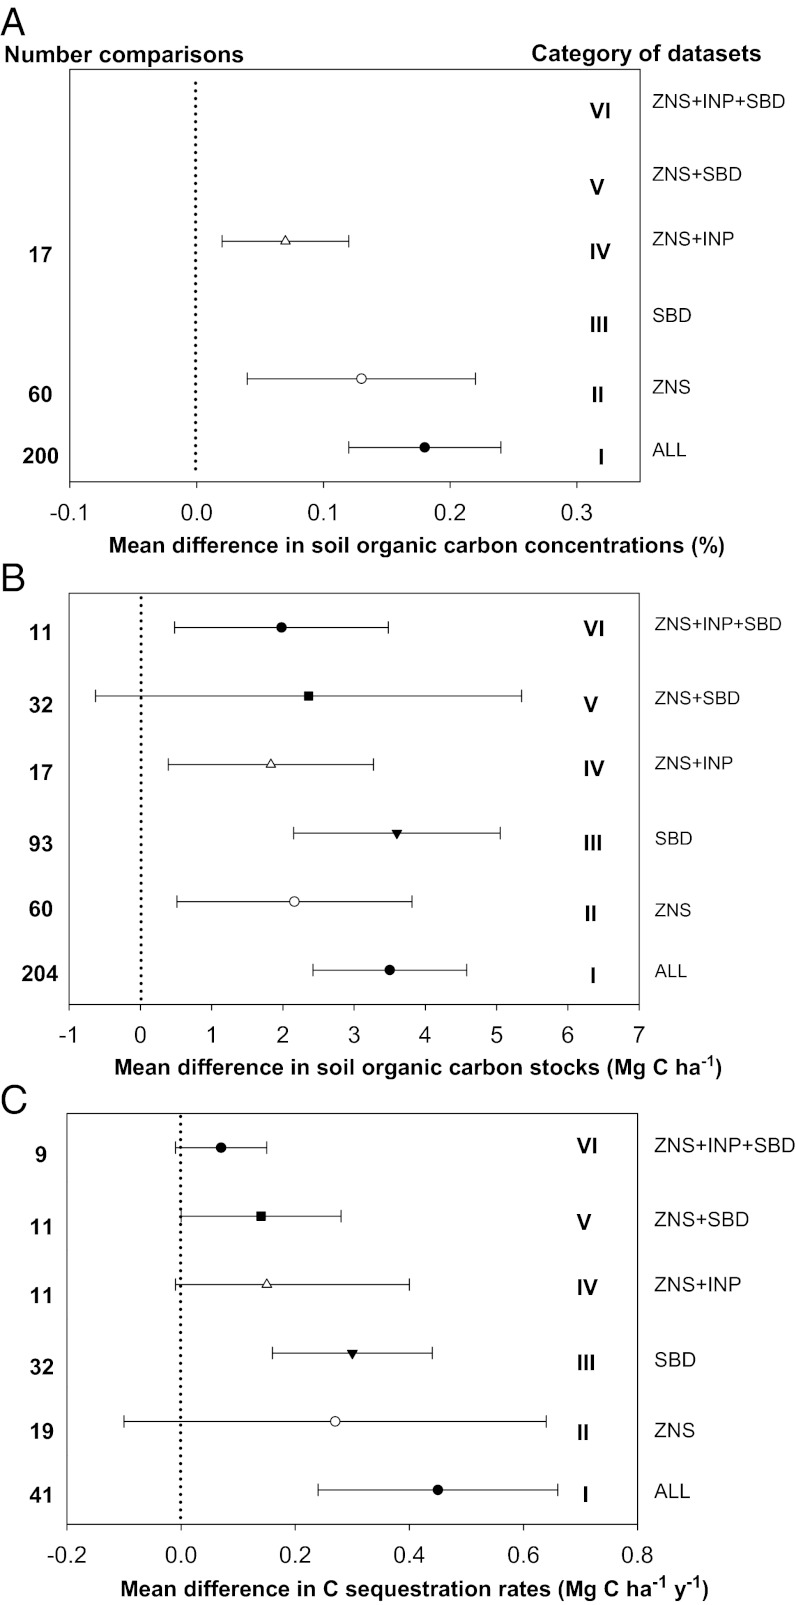
Fig. 1.
Mean difference in (A) SOC concentrations, (B) SOC stocks, and (C) C sequestration rates of soils under organic vs. nonorganic management, grouped according to different dataset categories after removal of outliers. Category I: total dataset (ALL); II: dataset containing only those studies in which the organic treatment is ≤1.0 ELU ha−1, the threshold for zero net input systems (ZNS); III: dataset containing only those studies reporting measured soil bulk densities (SBD); IV: dataset containing only those studies in which the organic treatment is ≤1.0 ELU ha−1 and in which measured data of external annual C inputs were reported (ZNS+INP); V: dataset containing only those studies in which the organic treatment is ≤1.0 ELU ha−1 and in which measured data of soil bulk densities were reported (ZNS+SBD); VI: dataset containing only those studies in which the organic treatment is ≤1.0 ELU ha−1 and in which measured data of external annual C inputs and soil bulk densities were reported (ZNS+INP+SBD). Categories III, V, and VI are not reported for SOC concentrations, because the restriction on measured bulk densities is not relevant for the quality of the SOC concentration values. Horizontal bars show the 95% confidence interval. Numbers of comparisons are displayed for each dataset category along the y axis.

