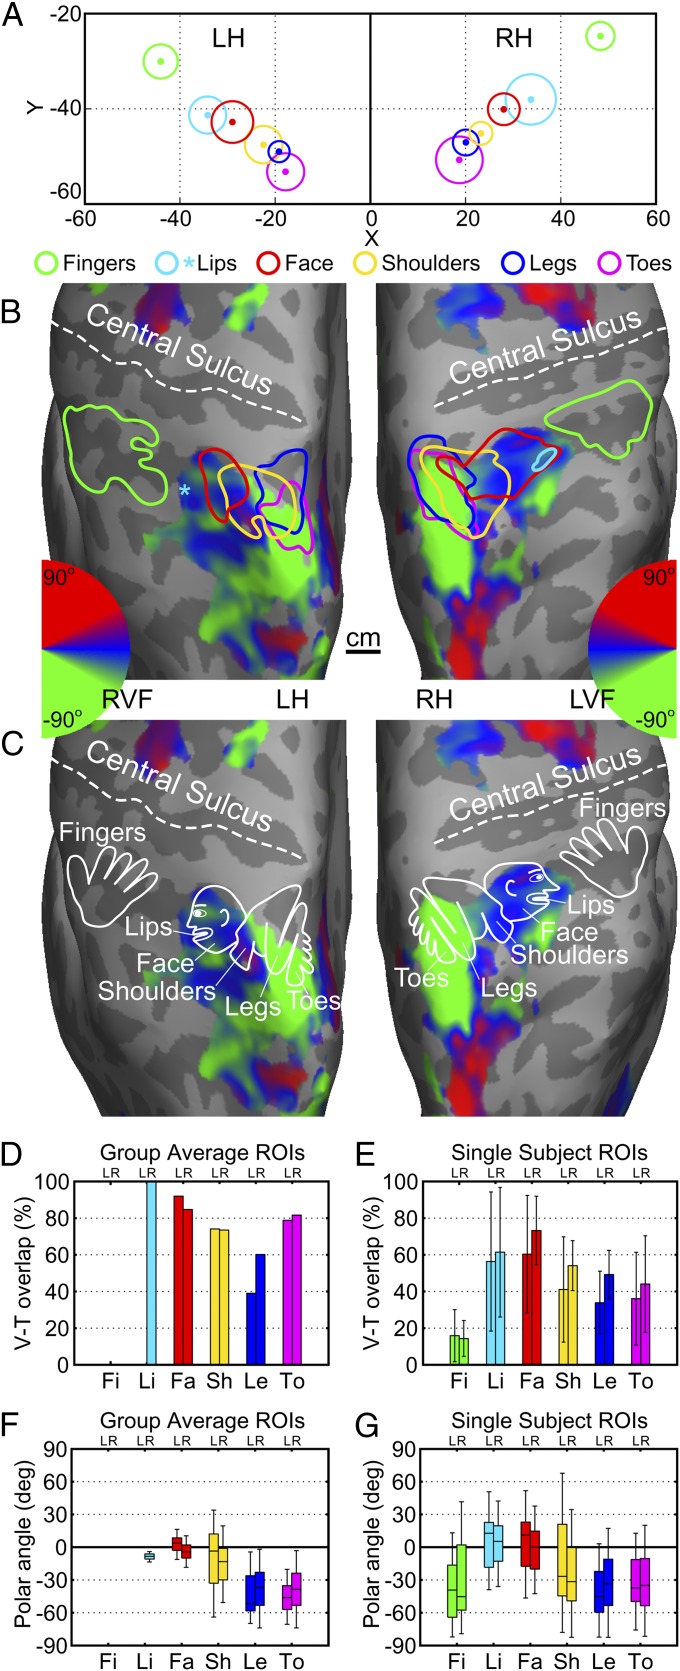
Fig. 3.
A multisensory homunculus in the superior posterior parietal cortex. (A) Distributions of Talairach coordinates of body-part ROI centers across subjects. Color dots, cluster centers; radius of each outer circle, SD of Euclidean distance from each cluster center (Table S1). (B) Contours of group-average body-part ROIs (P = 0.05, uncorrected) overlaid on group-average retinotopic maps (P = 0.05, uncorrected) rendered on subject 1’s cortical surfaces. A cyan asterisk indicates the location of average lip ROI center from the left hemispheres of subjects (n = 7) showing significant activations (Fig. S2C). Color wheels, polar angle of the contralateral visual hemifield. (C) A model of the parietal homunculus overlaid on group-average retinotopic maps. (D and E) Percentage of V-T overlap in each body-part ROI defined on group-average (D) and single-subject (E) maps. Error bar, SD. (F and G) Box plots of the distribution of polar angle within each body-part ROI outlined on group-average (F) and single-subject (G) maps. Each box represents the interquartile range, the line within each box indicates the median, and whiskers cover 90% of the distribution. LVF, left visual field; RVF, right visual field. LH and L, left hemisphere; RH and R, right hemisphere. Fi, fingers; Li, lips; Fa, face; Sh, shoulders; Le, legs; To, toes.

