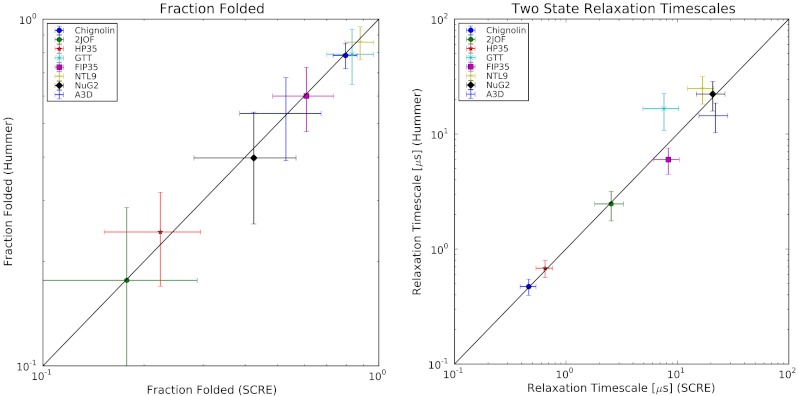
Fig. 2.
SCRE was used to estimate the fraction folded (A) and relaxation timescale (B) of each protein system. For fraction folded, we estimate error bars by  , where n is the number of independent folding events in each dataset. For relaxation timescales, we estimate error bars by
  . The disagreement for GTT is because we analyzed only a single trajectory whereas the previous analysis analyzed two trajectories with distinct folding kinetics.

