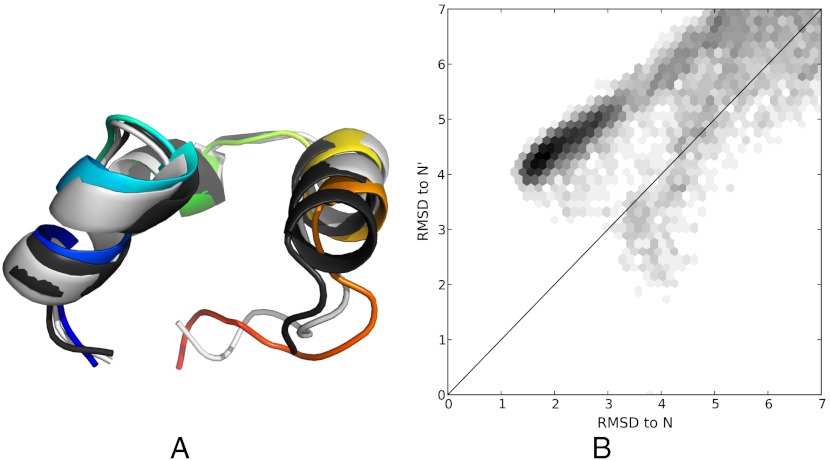
Fig. 6.
(A). Near-native (gray: 361 K, rainbow: 300 K) conformations are compared for both HP35 datasets. The crystal structure (PDB:2f4k) is shown in black. (B). A 2D RMSD histogram suggests that the 300 K simulations populate both the native and near-native states, with a population ratio of approximately 9∶1. The line x = y was used to separate the N and N’ states.

