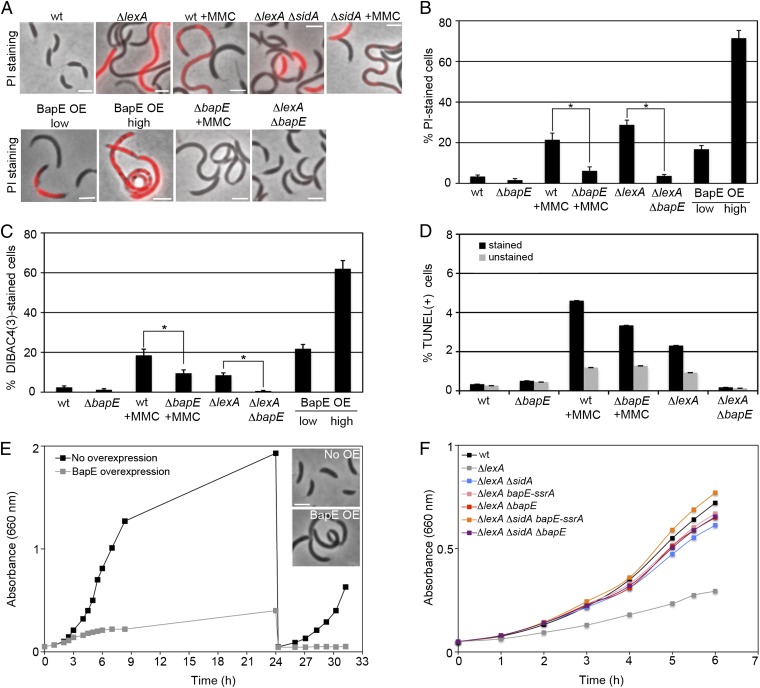
Fig. 1.
DNA-damage–induced BapE protein mediates apoptotic-like death. (A and B) Visualization and quantification of cell shape and PI-stained cells in mutant and MMC-treated cells. Asterisks denote significant differences of the percentage of PI-stained cells between MMC-treated wild-type and bapE mutant strains (P = 0.005) and ΔlexA and ΔlexA ΔbapE strains (P = 0.004). (C) Quantification of DIBAC4(3)-stained cells in mutant and MMC-treated cells. Asterisks denote significant differences of the percentage of DIBAC4(3)-stained cells between MMC-treated wild-type and bapE mutant strains (P = 0.01) and between ΔlexA and ΔlexA ΔbapE strains (P = 0.01). Microscopy images of DIBAC4(3)-stained cells are shown in Fig. S1A. (D) Quantification of TUNEL assays performed by fluorescence flow cytometry in mutant and MMC-treated cells. Due to a high-fluorescence background of nonapoptotic cells, control samples with no d-Transferase enzyme (unstained) were performed in parallel to samples treated with d-Transferase enzyme (stained). Flow cytometry plots are shown in Fig. S1B. (E) Growth curves of a BapE high-overexpression strain with and without xylose induction. ZG484 was grown in PYE supplemented with 0.3% xylose to induce BapE. After 24 h of growth, cultures were rediluted to an OD660 of 0.05 in fresh PYE medium with or without xylose. (Inset) Phase-contrast images from both cultures at time (t) = 24 h. (F) Growth curves of wild-type and ΔlexA mutant strains. (Scale bar, 2 μm in all images.) In all panels, error bars indicate SE of proportion.

