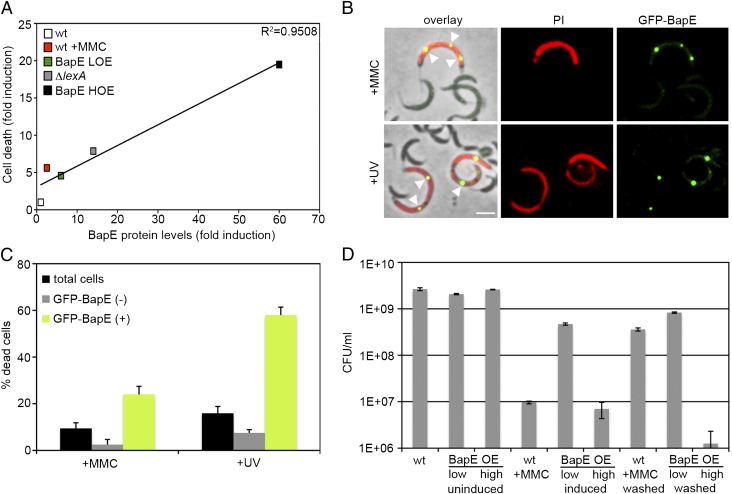
Fig. 3.
BapE induces cell death in a concentration-dependent manner. (A) Plot of cell death extent (based on PI staining) as a function of BapE protein levels in various strains (raw data for each are shown in Figs. S3 and S5). (B) Images of cells expressing GFP-BapE from its endogenous promoter (ZG683), grown either in the presence of MMC or after UV irradiation (12 h) and stained with PI to assess death. Arrowheads point to GFP-BapE foci in dead cells. (C) Quantification of the number of dead cells described in B after MMC treatment (n = 119) or after UV irradiation (n = 542) among all cells (black bars), among cells without localized GFP-BapE (gray bars), and among cells with GFP-BapE localized to discrete foci (green bars). Error bars represent SE. (Scale bar, 2 μm.) (D) Cell viability counts for the wild-type, low-BapE overexpressing and high-BapE overexpressing strains after 4 h of growth in the presence of either MMC or xylose to induce BapE expression (induced) and after the strains are shifted in fresh medium with no inducer (washed) for 2 h. Control cultures (uninduced) were grown in parallel. All error bars represent SD.

