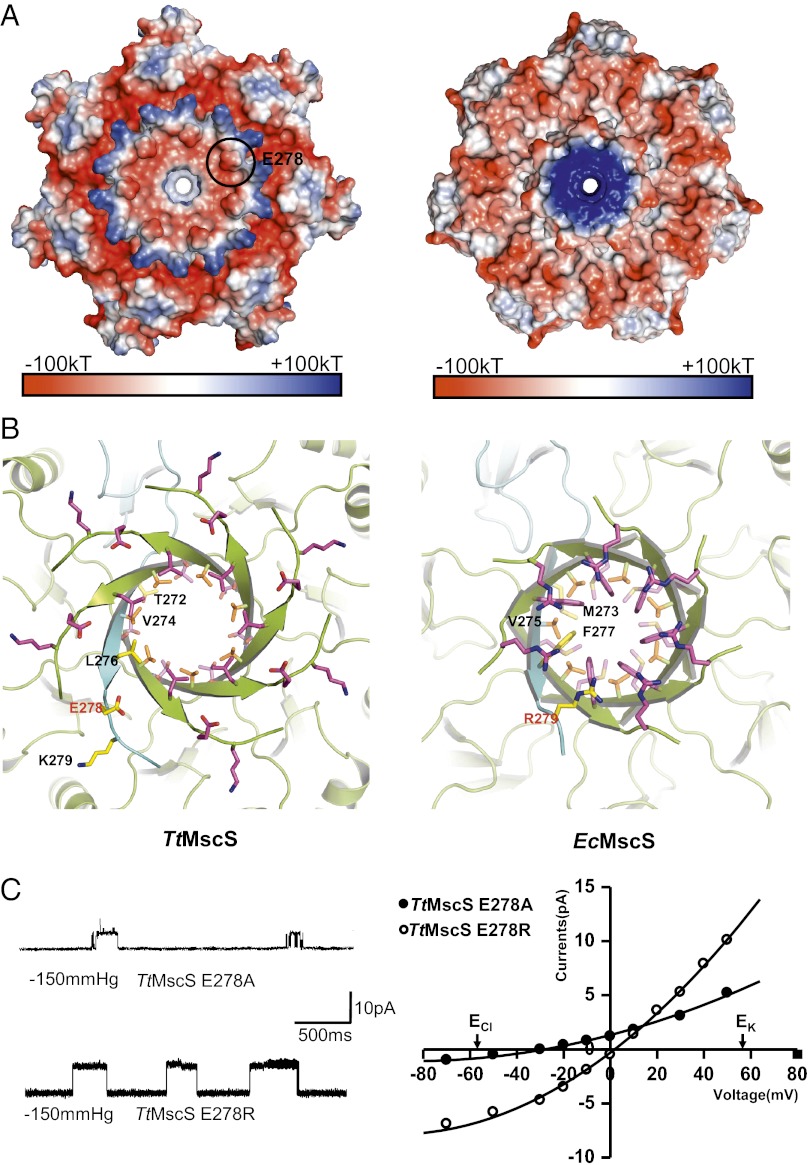
Fig. 6.
Mutations in the β-barrel region of TtMscS alter the channel’s selectivity. (A) The β-barrel region of TtMscS differs from that of EcMscS in size and electrostatic surface. Shown are electrostatic potential surfaces, showing close views of the C-terminal β-barrel regions of TtMscS (Left) and EcMscS (Right) observed from the cytoplasmic side. The blue, white, and red shadings represent positively charged, neutral, and negatively charged surface regions, respectively. One of the seven TtMscSE278 residues is indicated by a black circle. (B) The residues forming the β-barrel pore of TtMscS differ from those of EcMscS. Shown are ribbon diagrams, showing close views of the C-terminal β-barrel regions of TtMscS (Left) and EcMscS (Right) observed from the cytoplasmic side. The residues lining the pores are shown as sticks. One protomer is colored in cyan, and the others are colored in lemon. TtMscSE278 and EcMscSR279 are marked in red. (C) Mutations in the β-barrel region of TtMscS alter the channel’s selectivity. The single-channel openings shown on the left were recorded at +50 mV from the mutants as indicated. The reversal potentials derived from the I-V curves for E278A and E278R are −30 ± 2 mV (n = 4 patches) and 2 ± 0.7 mV (n = 4 patches), respectively. The salt gradient is same as that in Fig. 1B.

